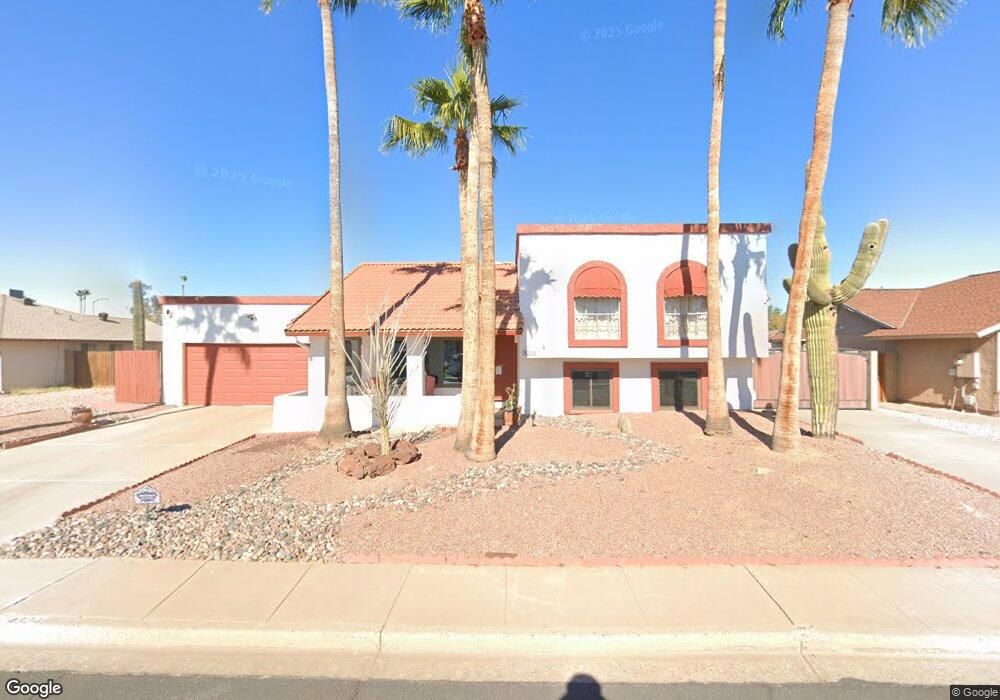
4334 E Decatur St Unit 1 Mesa, AZ 85205
The Groves NeighborhoodEstimated Value: $514,000 - $554,000
4
Beds
3
Baths
2,058
Sq Ft
$260/Sq Ft
Est. Value
About This Home
This home is located at 4334 E Decatur St Unit 1, Mesa, AZ 85205 and is currently estimated at $535,472, approximately $260 per square foot. 4334 E Decatur St Unit 1 is a home located in Maricopa County with nearby schools including Entz Elementary School, Franklin at Brimhall Elementary School, and Franklin West Elementary School.
Ownership History
Date
Name
Owned For
Owner Type
Purchase Details
Closed on
Apr 12, 2011
Sold by
Origins Capital Llc
Bought by
Coigny John U and Coigny Michelle L
Current Estimated Value
Home Financials for this Owner
Home Financials are based on the most recent Mortgage that was taken out on this home.
Original Mortgage
$157,500
Outstanding Balance
$109,167
Interest Rate
4.9%
Mortgage Type
VA
Estimated Equity
$426,305
Purchase Details
Closed on
Sep 13, 2010
Sold by
Pierce Theodore H and Pierce June A
Bought by
Origins Capital Llc
Create a Home Valuation Report for This Property
The Home Valuation Report is an in-depth analysis detailing your home's value as well as a comparison with similar homes in the area
Home Values in the Area
Average Home Value in this Area
Purchase History
| Date | Buyer | Sale Price | Title Company |
|---|---|---|---|
| Coigny John U | $157,500 | Fidelity National Title Insu | |
| Origins Capital Llc | $106,000 | None Available |
Source: Public Records
Mortgage History
| Date | Status | Borrower | Loan Amount |
|---|---|---|---|
| Open | Coigny John U | $157,500 |
Source: Public Records
Tax History
| Year | Tax Paid | Tax Assessment Tax Assessment Total Assessment is a certain percentage of the fair market value that is determined by local assessors to be the total taxable value of land and additions on the property. | Land | Improvement |
|---|---|---|---|---|
| 2025 | $1,772 | $20,808 | -- | -- |
| 2024 | $1,791 | $19,817 | -- | -- |
| 2023 | $1,791 | $35,870 | $7,170 | $28,700 |
| 2022 | $1,753 | $28,070 | $5,610 | $22,460 |
| 2021 | $1,792 | $27,270 | $5,450 | $21,820 |
| 2020 | $1,767 | $25,060 | $5,010 | $20,050 |
| 2019 | $1,640 | $23,060 | $4,610 | $18,450 |
| 2018 | $1,564 | $21,050 | $4,210 | $16,840 |
| 2017 | $1,516 | $19,600 | $3,920 | $15,680 |
| 2016 | $1,481 | $19,200 | $3,840 | $15,360 |
| 2015 | $1,402 | $18,280 | $3,650 | $14,630 |
Source: Public Records
Map
Nearby Homes
- 4429 E Downing Cir
- 4530 E Decatur St
- 4556 E Downing St
- 4065 E University Dr Unit 157
- 4650 E Decatur St
- 4562 E Elmwood St
- 4245 E Fountain St
- 4335 E Fox Cir
- 3920 E Ellis St
- 625 N 38th St
- 4065 E University Dr Unit 433
- 4065 E University Dr Unit 50
- 4065 E University Dr Unit 430
- 4065 E University Dr Unit 136
- 4065 E University Dr Unit 516
- 4065 E University Dr Unit 456
- 4065 E University Dr Unit 344
- 4065 E University Dr Unit 476
- 4065 E University Dr Unit 58
- 4065 E University Dr Unit 285
- 4322 E Decatur St Unit I
- 4346 E Decatur St
- 4337 E Dover St
- 4329 E Dover St
- 4349 E Dover St
- 4358 E Decatur St Unit I
- 4335 E Decatur St Unit 1
- 4310 E Decatur St
- 4347 E Decatur St
- 4327 E Decatur St
- 4357 E Dover St
- 4317 E Dover St
- 4359 E Decatur St
- 4315 E Decatur St
- 4302 E Decatur St
- 4305 E Dover St
- 4336 E Dover St Unit 1
- 4348 E Dover St
- 4328 E Dover St
- 4303 E Decatur St Unit 1
Your Personal Tour Guide
Ask me questions while you tour the home.