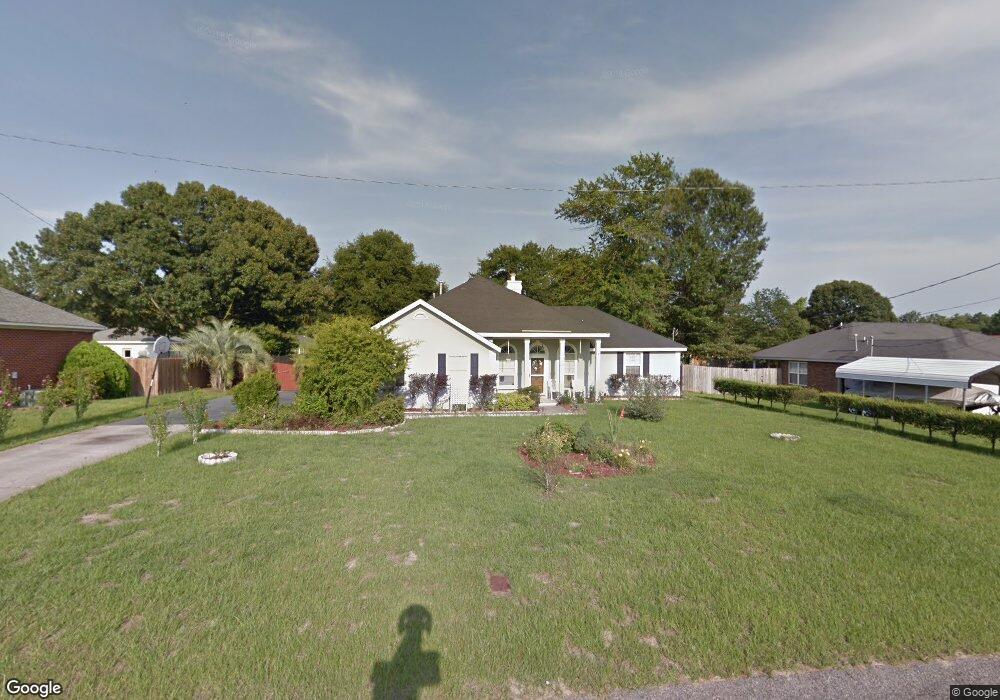
4335 Big Dipper Cir Hephzibah, GA 30815
Goshen NeighborhoodEstimated Value: $250,000 - $283,000
3
Beds
2
Baths
1,809
Sq Ft
$145/Sq Ft
Est. Value
About This Home
This home is located at 4335 Big Dipper Cir, Hephzibah, GA 30815 and is currently estimated at $261,710, approximately $144 per square foot. 4335 Big Dipper Cir is a home located in Richmond County with nearby schools including Goshen Elementary School, Pine Hill Middle School, and Johnson Magnet.
Ownership History
Date
Name
Owned For
Owner Type
Purchase Details
Closed on
Jan 18, 2001
Sold by
Kotas Roy David and Kotas Robin Overton
Bought by
Weatherspoon Donnell J and Weatherspoon Christine R
Current Estimated Value
Home Financials for this Owner
Home Financials are based on the most recent Mortgage that was taken out on this home.
Original Mortgage
$119,622
Outstanding Balance
$43,256
Interest Rate
7.44%
Mortgage Type
FHA
Estimated Equity
$218,454
Purchase Details
Closed on
Sep 7, 1995
Sold by
Waller Craig E
Bought by
Kotas Roy David
Purchase Details
Closed on
Oct 12, 1994
Sold by
Palumbo Franco D
Bought by
Waller Craig E
Purchase Details
Closed on
Sep 30, 1992
Sold by
Lamb W Thomas
Bought by
Lamb W Thomas
Purchase Details
Closed on
Jul 23, 1990
Sold by
Palumbo Franco D and Palumbo
Bought by
Palumbo Franco D and Palumbo
Purchase Details
Closed on
Sep 23, 1986
Sold by
Palumbo Franco D
Bought by
Lamb W Thomas Steinberg Maurice
Create a Home Valuation Report for This Property
The Home Valuation Report is an in-depth analysis detailing your home's value as well as a comparison with similar homes in the area
Home Values in the Area
Average Home Value in this Area
Purchase History
| Date | Buyer | Sale Price | Title Company |
|---|---|---|---|
| Weatherspoon Donnell J | $121,500 | -- | |
| Kotas Roy David | $95,500 | -- | |
| Waller Craig E | $12,500 | -- | |
| Lamb W Thomas | -- | -- | |
| Palumbo Franco D | -- | -- | |
| Lamb W Thomas Steinberg Maurice | $40,000 | -- |
Source: Public Records
Mortgage History
| Date | Status | Borrower | Loan Amount |
|---|---|---|---|
| Open | Weatherspoon Donnell J | $119,622 |
Source: Public Records
Tax History Compared to Growth
Tax History
| Year | Tax Paid | Tax Assessment Tax Assessment Total Assessment is a certain percentage of the fair market value that is determined by local assessors to be the total taxable value of land and additions on the property. | Land | Improvement |
|---|---|---|---|---|
| 2025 | $470 | $96,012 | $9,360 | $86,652 |
| 2024 | $470 | $94,504 | $9,360 | $85,144 |
| 2023 | $406 | $81,244 | $9,360 | $71,884 |
| 2022 | $396 | $62,191 | $9,360 | $52,831 |
| 2021 | $396 | $47,841 | $9,360 | $38,481 |
| 2020 | $396 | $47,841 | $9,360 | $38,481 |
| 2019 | $1,782 | $47,841 | $9,360 | $38,481 |
| 2018 | $1,793 | $47,841 | $9,360 | $38,481 |
| 2017 | $1,760 | $47,841 | $9,360 | $38,481 |
| 2016 | $1,855 | $47,841 | $9,360 | $38,481 |
| 2015 | $1,773 | $47,841 | $9,360 | $38,481 |
| 2014 | $1,775 | $47,841 | $9,360 | $38,481 |
Source: Public Records
Map
Nearby Homes
- 4331 Big Dipper Cir
- 1663 Pine Ridge Dr N
- 1679 Pine Ridge Dr N
- 1686 Pine Ridge Dr N
- 4065 Goshen Lake Dr S
- 1715 Pine Ridge Dr N
- 1724 Pine Ridge Dr N
- 1660 Pine Ridge Dr N
- 4051 Goshen Lake Dr S
- 2114 Southlake Pkwy
- 2121 Southlake Pkwy
- 4047 Goshen Lake Dr S
- 4038 Goshen Lake Dr S
- 1671 Pine Ridge Dr N
- 4036 Goshen Lake Dr S
- 4077 Burning Tree Ln
- 4149 Markwalter Rd
- 1683 Pine Ridge Dr N
- 4034 Burning Tree Ln
- 4053 Burning Tree Ln
- 4337 Big Dipper Cir
- 4333 Big Dipper Cir
- 4307 Big Dipper Cir
- 4339 Big Dipper Cir
- 4309 Big Dipper Cir
- 4305 Big Dipper Cir
- 4348 Big Dipper Cir
- 4350 Big Dipper Cir
- 4346 Big Dipper Cir
- 4311 Big Dipper Cir
- 4303 Big Dipper Cir
- 4329 Big Dipper Cir
- 4341 Big Dipper Cir
- 4343 Big Dipper Cir
- 4313 Big Dipper Cir
- 4301 Big Dipper Cir
- 4342 Big Dipper Cir
- 4327 Big Dipper Cir
- 1059 Woodberry Dr
- 1057 Woodberry Dr