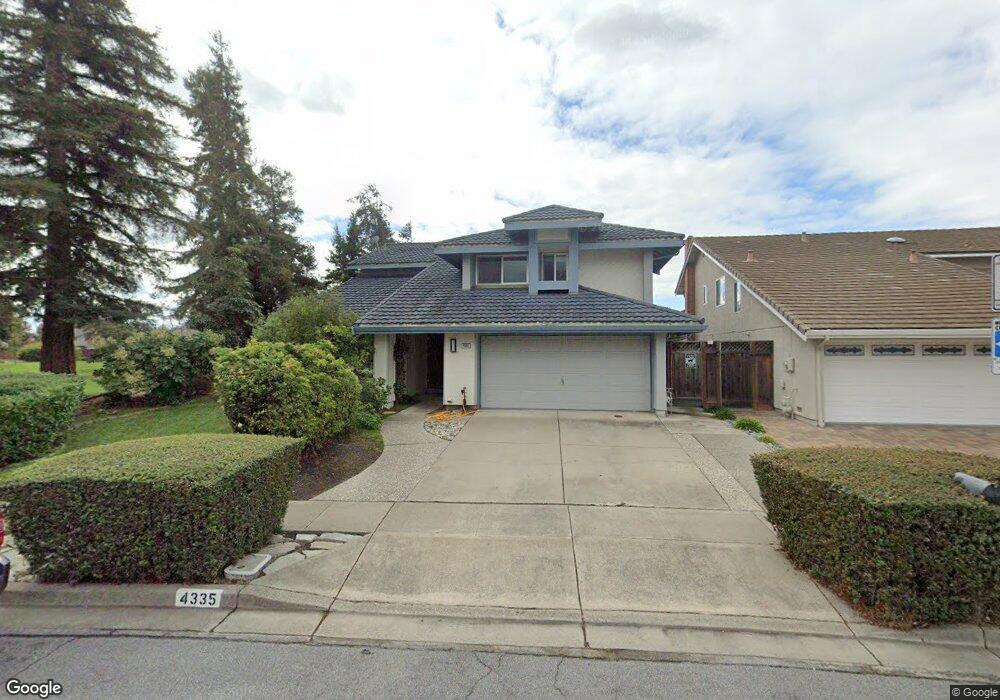
4335 Mockingbird Way Fremont, CA 94555
Alvarado NeighborhoodEstimated Value: $2,039,000 - $2,464,872
4
Beds
3
Baths
2,762
Sq Ft
$843/Sq Ft
Est. Value
About This Home
This home is located at 4335 Mockingbird Way, Fremont, CA 94555 and is currently estimated at $2,328,968, approximately $843 per square foot. 4335 Mockingbird Way is a home located in Alameda County with nearby schools including Ardenwood Elementary, Thornton Middle School, and American High School.
Ownership History
Date
Name
Owned For
Owner Type
Purchase Details
Closed on
Aug 22, 2016
Sold by
Velasco Roque A and Metcalf Tierney Beth A
Bought by
Velasco Roque A and Metcalf Tierney Beth A
Current Estimated Value
Home Financials for this Owner
Home Financials are based on the most recent Mortgage that was taken out on this home.
Original Mortgage
$696,000
Outstanding Balance
$554,249
Interest Rate
3.42%
Mortgage Type
New Conventional
Estimated Equity
$1,774,719
Purchase Details
Closed on
Jul 8, 2004
Sold by
Brown Mark A and Brown Linda M
Bought by
Metcalf Beth A and Velasco Roque A
Home Financials for this Owner
Home Financials are based on the most recent Mortgage that was taken out on this home.
Original Mortgage
$444,640
Interest Rate
5.87%
Mortgage Type
Purchase Money Mortgage
Create a Home Valuation Report for This Property
The Home Valuation Report is an in-depth analysis detailing your home's value as well as a comparison with similar homes in the area
Home Values in the Area
Average Home Value in this Area
Purchase History
| Date | Buyer | Sale Price | Title Company |
|---|---|---|---|
| Velasco Roque A | -- | Stewart Title Of Ca Inc | |
| Metcalf Beth A | $635,500 | First American Title Co |
Source: Public Records
Mortgage History
| Date | Status | Borrower | Loan Amount |
|---|---|---|---|
| Open | Velasco Roque A | $696,000 | |
| Closed | Metcalf Beth A | $444,640 | |
| Closed | Metcalf Beth A | $95,280 |
Source: Public Records
Tax History Compared to Growth
Tax History
| Year | Tax Paid | Tax Assessment Tax Assessment Total Assessment is a certain percentage of the fair market value that is determined by local assessors to be the total taxable value of land and additions on the property. | Land | Improvement |
|---|---|---|---|---|
| 2025 | $10,658 | $885,747 | $265,724 | $620,023 |
| 2024 | $10,658 | $868,384 | $260,515 | $607,869 |
| 2023 | $10,374 | $851,360 | $255,408 | $595,952 |
| 2022 | $10,243 | $834,671 | $250,401 | $584,270 |
| 2021 | $9,992 | $818,307 | $245,492 | $572,815 |
| 2020 | $10,026 | $809,918 | $242,975 | $566,943 |
| 2019 | $9,912 | $794,044 | $238,213 | $555,831 |
| 2018 | $9,720 | $778,480 | $233,544 | $544,936 |
| 2017 | $9,478 | $763,221 | $228,966 | $534,255 |
| 2016 | $9,319 | $748,262 | $224,478 | $523,784 |
| 2015 | $9,197 | $737,027 | $221,108 | $515,919 |
| 2014 | $9,041 | $722,594 | $216,778 | $505,816 |
Source: Public Records
Map
Nearby Homes
- 4141 Deep Creek Rd Unit 89
- 4141 Deep Creek Rd Unit 106
- 4141 Deep Creek Rd Unit 180
- 34103 Zaner Way
- 34102 Zaner Way
- 33787 Shylock Dr
- 33010 Lake Mead Dr
- 324 Waikiki Cir
- 328 Waikiki Cir
- 4639 Michelle Ct
- 437 Samoa Cir Unit 437
- 269 Oahu Cir
- 4201 Saturn Way
- 259 Molokai Cir Unit 259
- 192 Hawaii Cir
- 4506 Birchwood Ct
- 34319 Chester Ct
- 4943 Antioch Loop
- 32409 Elizabeth Way
- 23 Palm Dr
- 4325 Mockingbird Way
- 33246 Falcon Dr
- 33242 Falcon Dr
- 4315 Mockingbird Way
- 33238 Falcon Dr
- 4320 Mockingbird Way
- 4338 Mockingbird Way
- 33234 Falcon Dr
- 4305 Mockingbird Way
- 33230 Falcon Dr
- 4350 Peregrine Way
- 4300 Mockingbird Way
- 4315 Peregrine Way
- 4340 Peregrine Way
- 4370 Peregrine Way
- 4295 Mockingbird Way
- 4380 Peregrine Way
- 33226 Falcon Dr
- 33245 Falcon Dr
- 33251 Falcon Dr