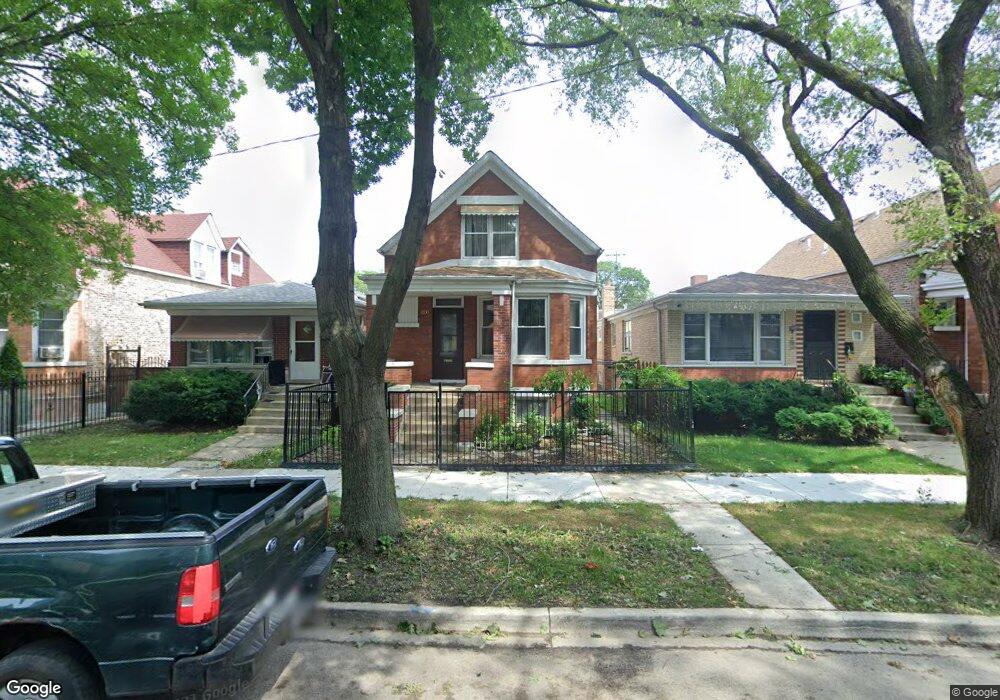
4335 S Campbell Ave Unit 3 Chicago, IL 60632
Brighton Park NeighborhoodEstimated Value: $265,667 - $319,000
3
Beds
1
Bath
1,500
Sq Ft
$189/Sq Ft
Est. Value
About This Home
This home is located at 4335 S Campbell Ave Unit 3, Chicago, IL 60632 and is currently estimated at $283,889, approximately $189 per square foot. 4335 S Campbell Ave Unit 3 is a home located in Cook County with nearby schools including Shields Elementary School, Shields Middle School, and Kelly High School.
Ownership History
Date
Name
Owned For
Owner Type
Purchase Details
Closed on
Oct 5, 2015
Sold by
Liang Yan Li and Tran Thang Cuong
Bought by
Tran Thang Cuong and Liang Yanli
Current Estimated Value
Purchase Details
Closed on
Oct 3, 2013
Sold by
Stanger Gail
Bought by
Liang Yan Li
Home Financials for this Owner
Home Financials are based on the most recent Mortgage that was taken out on this home.
Original Mortgage
$32,000
Outstanding Balance
$7,906
Interest Rate
3.25%
Mortgage Type
Unknown
Estimated Equity
$275,983
Purchase Details
Closed on
Aug 21, 2009
Sold by
Hoffman Wanda and Stanger Gail
Bought by
Hoffman Wanda and Stanger Gail
Purchase Details
Closed on
Apr 2, 2001
Sold by
Hoffman Wanda
Bought by
Hoffman Wanda and Stanger Gail S
Create a Home Valuation Report for This Property
The Home Valuation Report is an in-depth analysis detailing your home's value as well as a comparison with similar homes in the area
Home Values in the Area
Average Home Value in this Area
Purchase History
| Date | Buyer | Sale Price | Title Company |
|---|---|---|---|
| Tran Thang Cuong | -- | Chicago Title Insurance Co | |
| Liang Yan Li | $65,000 | Attorneys Title Guaranty Fun | |
| Hoffman Wanda | -- | Torrens Titles | |
| Hoffman Wanda | -- | -- |
Source: Public Records
Mortgage History
| Date | Status | Borrower | Loan Amount |
|---|---|---|---|
| Open | Liang Yan Li | $32,000 |
Source: Public Records
Tax History Compared to Growth
Tax History
| Year | Tax Paid | Tax Assessment Tax Assessment Total Assessment is a certain percentage of the fair market value that is determined by local assessors to be the total taxable value of land and additions on the property. | Land | Improvement |
|---|---|---|---|---|
| 2024 | $2,069 | $26,000 | $4,030 | $21,970 |
| 2023 | $1,708 | $15,719 | $3,224 | $12,495 |
| 2022 | $1,708 | $15,719 | $3,224 | $12,495 |
| 2021 | $3,419 | $17,000 | $3,224 | $13,776 |
| 2020 | $1,413 | $14,827 | $3,224 | $11,603 |
| 2019 | $1,408 | $16,849 | $3,224 | $13,625 |
| 2018 | $1,387 | $16,849 | $3,224 | $13,625 |
| 2017 | $1,636 | $15,792 | $2,901 | $12,891 |
| 2016 | $110 | $15,792 | $2,901 | $12,891 |
| 2015 | $2,915 | $15,792 | $2,901 | $12,891 |
| 2014 | $2,691 | $14,390 | $2,740 | $11,650 |
| 2013 | $2,638 | $14,390 | $2,740 | $11,650 |
Source: Public Records
Map
Nearby Homes
- 4334 S Western Ave
- 4417 S Campbell Ave
- 4415 S Rockwell St
- 4759 S Maplewood Ave
- 4757 S Maplewood Ave
- 4756 S Maplewood Ave
- 4149 S Rockwell St
- 4759 S Rockwell St
- 4756 S Rockwell St
- 4754 S Rockwell St
- 2719 W Pope John Paul ii Dr
- 4609 S Rockwell St
- 4034 S Maplewood Ave
- 4331 S California Ave
- 2457 W 46th Place
- 4554 S Washtenaw Ave
- 4024 S Rockwell St
- 4002 S Western Ave Unit 2
- 4605 S Fairfield Ave
- 4039 S Montgomery Ave
- 4335 S Campbell Ave
- 4337 S Campbell Ave
- 4333 S Campbell Ave
- 4341 S Campbell Ave
- 4329 S Campbell Ave
- 4343 S Campbell Ave
- 4327 S Campbell Ave
- 4327 S Campbell Ave
- 4345 S Campbell Ave
- 4325 S Campbell Ave
- 4347 S Campbell Ave
- 4347 S Campbell Ave
- 4323 S Campbell Ave
- 4321 S Campbell Ave Unit ONE
- 4340 S Artesian Ave
- 4340 S Artesian Ave
- 4351 S Campbell Ave
- 4336 S Artesian Ave
- 4319 S Campbell Ave
- 4332 S Artesian Ave