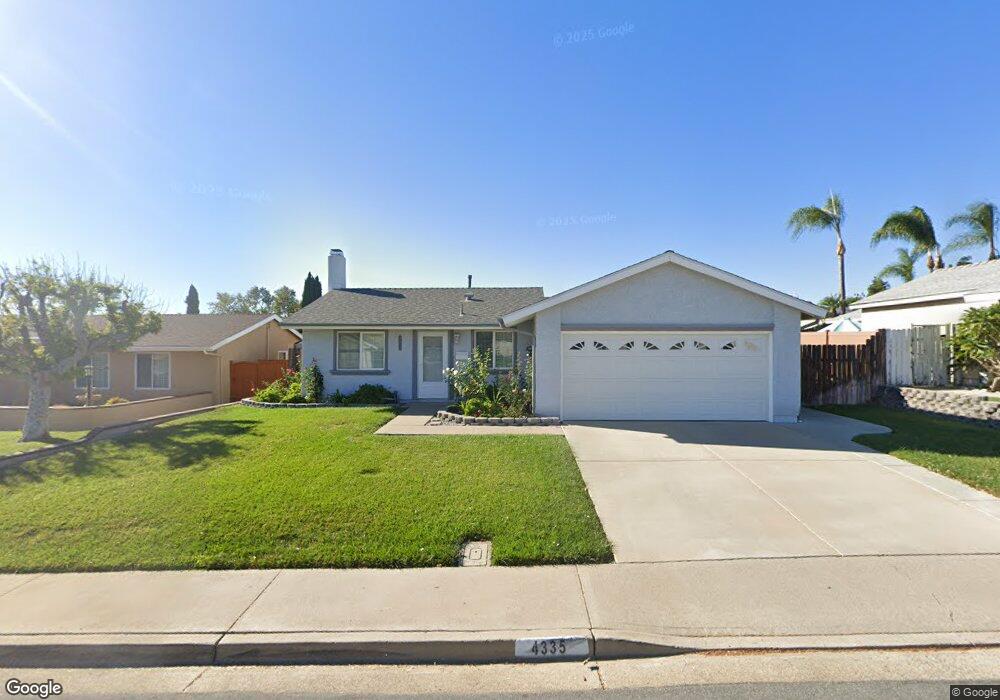
4335 Via de Los Robles Yorba Linda, CA 92886
Estimated Value: $937,398 - $1,120,000
3
Beds
2
Baths
1,152
Sq Ft
$928/Sq Ft
Est. Value
About This Home
This home is located at 4335 Via de Los Robles, Yorba Linda, CA 92886 and is currently estimated at $1,069,100, approximately $928 per square foot. 4335 Via de Los Robles is a home located in Orange County with nearby schools including Fairmont Elementary, Bernardo Yorba Middle School, and Yorba Linda High School.
Ownership History
Date
Name
Owned For
Owner Type
Purchase Details
Closed on
May 12, 2020
Sold by
Chira Ilie and Chira Ecaterina
Bought by
Chira Ilie and Chira Ecaterina Eleonora
Current Estimated Value
Purchase Details
Closed on
Apr 9, 2003
Sold by
Johnson Adam Taylor and Johnson Catherine Gayle
Bought by
Chira Ilie and Chira Ecaterina
Home Financials for this Owner
Home Financials are based on the most recent Mortgage that was taken out on this home.
Original Mortgage
$171,000
Interest Rate
5.84%
Purchase Details
Closed on
Mar 13, 2001
Sold by
Hahlbeck Michelle L and Hahlbeck Dale R
Bought by
Johnson Adam Taylor and French Catherine Gayle
Home Financials for this Owner
Home Financials are based on the most recent Mortgage that was taken out on this home.
Original Mortgage
$208,700
Interest Rate
7.09%
Create a Home Valuation Report for This Property
The Home Valuation Report is an in-depth analysis detailing your home's value as well as a comparison with similar homes in the area
Home Values in the Area
Average Home Value in this Area
Purchase History
| Date | Buyer | Sale Price | Title Company |
|---|---|---|---|
| Chira Ilie | -- | None Available | |
| Chira Ilie | $371,000 | Landwood Title Company | |
| Johnson Adam Taylor | $261,000 | Orange Coast Title |
Source: Public Records
Mortgage History
| Date | Status | Borrower | Loan Amount |
|---|---|---|---|
| Closed | Chira Ilie | $171,000 | |
| Previous Owner | Johnson Adam Taylor | $208,700 | |
| Closed | Johnson Adam Taylor | $52,150 |
Source: Public Records
Tax History Compared to Growth
Tax History
| Year | Tax Paid | Tax Assessment Tax Assessment Total Assessment is a certain percentage of the fair market value that is determined by local assessors to be the total taxable value of land and additions on the property. | Land | Improvement |
|---|---|---|---|---|
| 2025 | $6,143 | $537,323 | $447,345 | $89,978 |
| 2024 | $6,143 | $526,788 | $438,574 | $88,214 |
| 2023 | $6,028 | $516,459 | $429,974 | $86,485 |
| 2022 | $5,963 | $506,333 | $421,543 | $84,790 |
| 2021 | $5,854 | $496,405 | $413,277 | $83,128 |
| 2020 | $5,754 | $491,315 | $409,039 | $82,276 |
| 2019 | $5,552 | $481,682 | $401,019 | $80,663 |
| 2018 | $5,482 | $472,238 | $393,156 | $79,082 |
| 2017 | $5,392 | $462,979 | $385,447 | $77,532 |
| 2016 | $5,283 | $453,901 | $377,889 | $76,012 |
| 2015 | $5,218 | $447,083 | $372,212 | $74,871 |
| 2014 | $5,064 | $438,326 | $364,921 | $73,405 |
Source: Public Records
Map
Nearby Homes
- 4362 Via Alegre
- 20212 Chianti Ct
- 20100 Livorno Ln
- 4446 Avenida de Las Flores
- 4545 Avenida Rio Del Oro
- 4418 Avenida Del Este
- 19911 Malaga Ln
- 4066 Villa Quintana
- 91 VAC/COR E Avenue L
- 4154 Princeton Place
- 4710 Avenida Del Este
- 20000 Villa Torino
- 4080 Naples Ct
- 4090 Naples Ct
- 4832 Via Frondosa
- 19841 Lombardy Ln
- 19818 Cornell Ln
- 21590 Via Pepita
- 4152 Beech Ave
- 20640 Smoketree Ave
- 4345 Via de Los Robles
- 4325 Via de Los Robles
- 4334 Via Del Ganadero
- 4324 Via Del Ganadero
- 4355 Via de Los Robles
- 4315 Via de Los Robles
- 4344 Via Del Ganadero
- 4334 Via de Los Robles
- 4314 Via Del Ganadero
- 4344 Via de Los Robles
- 4324 Via de Los Robles
- 4354 Via Del Ganadero
- 4354 Via de Los Robles
- 4305 Via de Los Robles
- 4365 Via de Los Robles
- 4314 Via de Los Robles
- 4304 Via Del Ganadero
- 4364 Via de Los Robles
- 4364 Via Del Ganadero
- 4304 Via de Los Robles