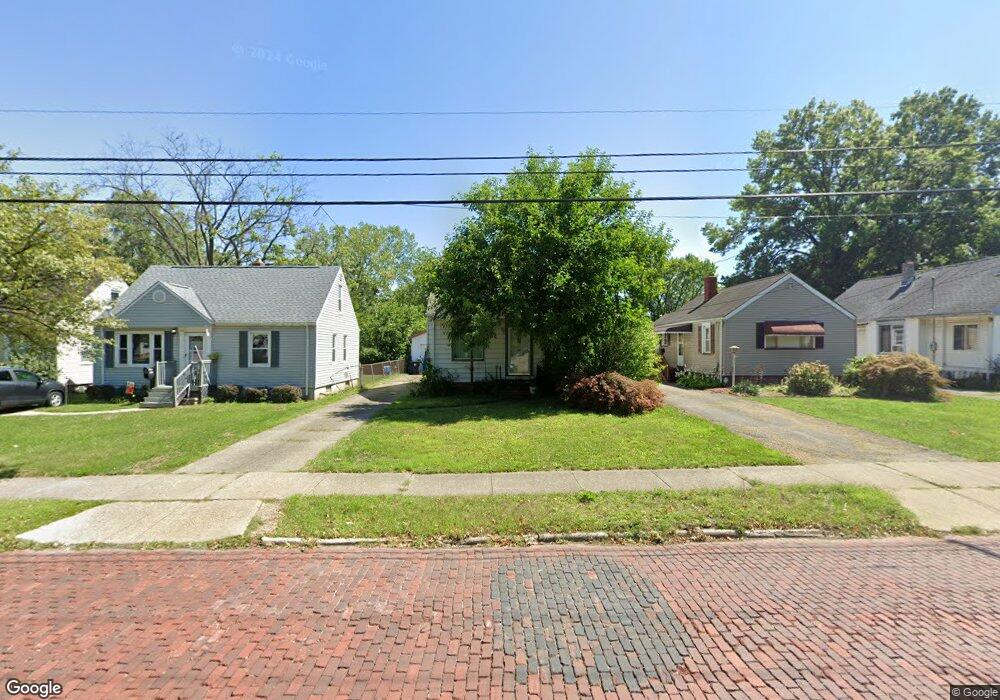
4335 W 143rd St Cleveland, OH 44135
Jefferson NeighborhoodEstimated Value: $135,000 - $151,000
2
Beds
1
Bath
1,125
Sq Ft
$129/Sq Ft
Est. Value
About This Home
This home is located at 4335 W 143rd St, Cleveland, OH 44135 and is currently estimated at $145,628, approximately $129 per square foot. 4335 W 143rd St is a home located in Cuyahoga County with nearby schools including Artemus Ward School, Almira Academy, and Benjamin Franklin.
Ownership History
Date
Name
Owned For
Owner Type
Purchase Details
Closed on
Oct 13, 2010
Sold by
Fannie Mae
Bought by
Ulmer Richard E
Current Estimated Value
Purchase Details
Closed on
Aug 5, 2010
Sold by
Kheralla Bassam
Bought by
Fanniemae
Purchase Details
Closed on
Feb 28, 2001
Sold by
Coulter Omer
Bought by
Kheralla Bassam and Kheralla Thelma J
Home Financials for this Owner
Home Financials are based on the most recent Mortgage that was taken out on this home.
Original Mortgage
$98,900
Interest Rate
7.06%
Purchase Details
Closed on
Jul 23, 1999
Sold by
Bittel Robert J
Bought by
Coulter Omer
Home Financials for this Owner
Home Financials are based on the most recent Mortgage that was taken out on this home.
Original Mortgage
$76,000
Interest Rate
7.54%
Purchase Details
Closed on
Aug 28, 1979
Sold by
Schonberger Frank and Schonberger Irma
Bought by
Bittel Robert J
Purchase Details
Closed on
Jan 1, 1975
Bought by
Schonberger Frank and Schonberger Irma
Create a Home Valuation Report for This Property
The Home Valuation Report is an in-depth analysis detailing your home's value as well as a comparison with similar homes in the area
Home Values in the Area
Average Home Value in this Area
Purchase History
| Date | Buyer | Sale Price | Title Company |
|---|---|---|---|
| Ulmer Richard E | $33,000 | Ohio Title Corp | |
| Fanniemae | $36,667 | None Available | |
| Kheralla Bassam | $110,000 | Prospect Title Agency Inc | |
| Coulter Omer | $113,000 | City Title Company | |
| Bittel Robert J | $46,000 | -- | |
| Schonberger Frank | -- | -- |
Source: Public Records
Mortgage History
| Date | Status | Borrower | Loan Amount |
|---|---|---|---|
| Previous Owner | Kheralla Bassam | $98,900 | |
| Previous Owner | Coulter Omer | $76,000 |
Source: Public Records
Tax History Compared to Growth
Tax History
| Year | Tax Paid | Tax Assessment Tax Assessment Total Assessment is a certain percentage of the fair market value that is determined by local assessors to be the total taxable value of land and additions on the property. | Land | Improvement |
|---|---|---|---|---|
| 2024 | $2,760 | $42,105 | $9,940 | $32,165 |
| 2023 | $2,329 | $30,700 | $7,600 | $23,100 |
| 2022 | $2,315 | $30,695 | $7,595 | $23,100 |
| 2021 | $2,292 | $30,700 | $7,600 | $23,100 |
| 2020 | $2,055 | $23,800 | $5,880 | $17,920 |
| 2019 | $1,900 | $68,000 | $16,800 | $51,200 |
| 2018 | $1,986 | $23,800 | $5,880 | $17,920 |
| 2017 | $2,043 | $24,780 | $4,690 | $20,090 |
| 2016 | $2,079 | $24,780 | $4,690 | $20,090 |
| 2015 | $3,546 | $24,780 | $4,690 | $20,090 |
| 2014 | $3,546 | $26,950 | $5,110 | $21,840 |
Source: Public Records
Map
Nearby Homes
- 4407 W 140th St
- 4322 W 138th St
- 14511 Saint James Ave
- 13904 Highlandview Ave
- 4497 W 147th St
- 4484 W 149th St
- 14434 Cleminshaw Rd
- 14212 Leroy Ave
- 4162 Victory Blvd
- 14513 Mission Rd
- 4046 W 143rd St
- 13410 Gilmore Ave
- 13401 Puritas Ave
- 13402 Saint James Ave
- 13313 Highlandview Ave
- 4349 W 132nd St
- 13810 Clifford Ave
- 4329 W 131st St
- 13209 Liberty Ave
- 13410 Wainfleet Ave
- 4331 W 143rd St
- 4339 W 143rd St
- 4343 W 143rd St
- 4327 W 143rd St
- 4347 W 143rd St
- 4323 W 143rd St
- 4319 W 143rd St
- 4351 W 143rd St
- 4342 W 143rd St
- 4346 W 143rd St
- W 143rd St
- 4338 W 143rd St
- 4326 W 143rd St
- 4350 W 143rd St
- 4307 W 143rd St
- 4355 W 143rd St
- 4318 W 143rd St
- 4359 W 143rd St
- 4352 W 143rd St
- 4306 W 143rd St