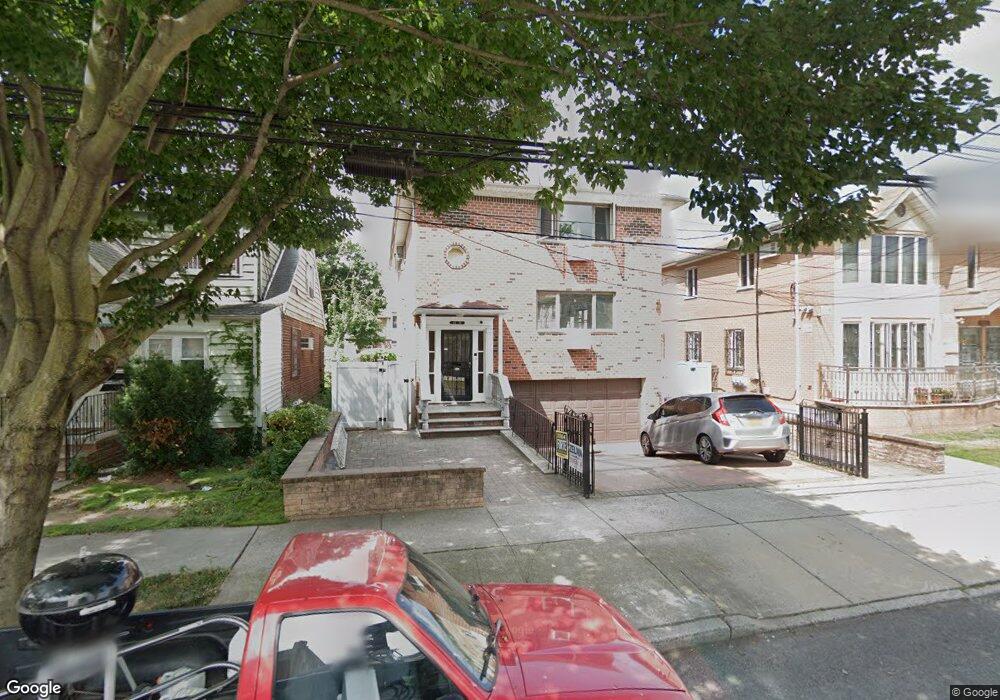
4336 161st St Flushing, NY 11358
Flushing NeighborhoodEstimated Value: $1,456,524 - $2,209,000
3
Beds
2
Baths
1,350
Sq Ft
$1,308/Sq Ft
Est. Value
About This Home
This home is located at 4336 161st St, Flushing, NY 11358 and is currently estimated at $1,765,131, approximately $1,307 per square foot. 4336 161st St is a home located in Queens County with nearby schools including I.S. 25 Adrien Block, Francis Lewis High School, and St. Andrew Avellino Catholic Academy.
Ownership History
Date
Name
Owned For
Owner Type
Purchase Details
Closed on
Jun 29, 2017
Sold by
Cerrito Rappa Maria and Rappa Angelo
Bought by
Gao Xiujin and Liu Qun
Current Estimated Value
Home Financials for this Owner
Home Financials are based on the most recent Mortgage that was taken out on this home.
Original Mortgage
$800,000
Outstanding Balance
$665,758
Interest Rate
3.95%
Mortgage Type
Purchase Money Mortgage
Estimated Equity
$1,099,373
Purchase Details
Closed on
May 2, 2017
Sold by
Rappa Giuseppe and Rappa Giuseppina
Bought by
Rappa Angelo and Rappa Maria Cerrito
Home Financials for this Owner
Home Financials are based on the most recent Mortgage that was taken out on this home.
Original Mortgage
$800,000
Outstanding Balance
$665,758
Interest Rate
3.95%
Mortgage Type
Purchase Money Mortgage
Estimated Equity
$1,099,373
Purchase Details
Closed on
Oct 3, 2013
Sold by
Rappa Angelo and Rappa Giuseppe
Bought by
Rappa Angelo
Purchase Details
Closed on
Jul 17, 2001
Sold by
Rappa Giuseppe
Bought by
Rappa Angelo
Create a Home Valuation Report for This Property
The Home Valuation Report is an in-depth analysis detailing your home's value as well as a comparison with similar homes in the area
Home Values in the Area
Average Home Value in this Area
Purchase History
| Date | Buyer | Sale Price | Title Company |
|---|---|---|---|
| Gao Xiujin | $1,530,000 | -- | |
| Rappa Angelo | -- | -- | |
| Rappa Angelo | -- | -- | |
| Rappa Angelo | -- | -- | |
| Rappa Angelo | -- | -- |
Source: Public Records
Mortgage History
| Date | Status | Borrower | Loan Amount |
|---|---|---|---|
| Open | Gao Xiujin | $800,000 |
Source: Public Records
Tax History Compared to Growth
Tax History
| Year | Tax Paid | Tax Assessment Tax Assessment Total Assessment is a certain percentage of the fair market value that is determined by local assessors to be the total taxable value of land and additions on the property. | Land | Improvement |
|---|---|---|---|---|
| 2025 | $13,994 | $73,254 | $16,771 | $56,483 |
| 2024 | $13,994 | $69,672 | $16,625 | $53,047 |
| 2023 | $13,354 | $66,486 | $15,043 | $51,443 |
| 2022 | $12,915 | $81,060 | $22,020 | $59,040 |
| 2021 | $13,510 | $86,700 | $22,020 | $64,680 |
| 2020 | $12,921 | $90,180 | $22,020 | $68,160 |
| 2019 | $12,146 | $77,220 | $22,020 | $55,200 |
| 2018 | $11,294 | $55,405 | $14,660 | $40,745 |
| 2017 | $10,691 | $53,913 | $16,178 | $37,735 |
| 2016 | $10,385 | $53,913 | $16,178 | $37,735 |
| 2015 | $5,915 | $50,871 | $18,665 | $32,206 |
| 2014 | $5,915 | $48,384 | $21,295 | $27,089 |
Source: Public Records
Map
Nearby Homes
- 4344 161st St
- 43-04 158th St Unit L2
- 43-04 158th St Unit 3E
- 4304 158th St Unit L4
- 43-7 162nd St
- 45-11 160th St
- 43-24 163rd St
- 45-14 161st St
- 42-16 162nd St
- 42-60 157th St Unit 3D
- 43-23 156th St
- 42-20 158th St
- 43-33 163rd St
- 45-11 157th St
- 16003 Sanford Ave
- 16001 Sanford Ave
- 163-02 45th Ave
- 45-57 160th St
- 43-15 164th St
- 42-36 156th St
- 43-36 161st St Unit 2 Fl
- 43-36 161st St Unit 1Fl
- 43-36 161st St
- 43-36 161st St Unit 2F
- 4336 161st St Unit 2Fl
- 4336 161st St Unit 1Fl
- 4336 161st St
- 43-32 161st St
- 4332 161st St
- 4340 161st St
- 4340 161st St
- 43-40 161st St
- 4328 161st St
- 43-44 161st St Unit 1st Fl
- 43-44 161st St Unit 3Fl
- 43-44 161st St
- 43-44 161st St Unit 3rd Fl
- 4344 161st St Unit 1
- 4344 161st St Unit 1FL
- 4344 161st St Unit 3