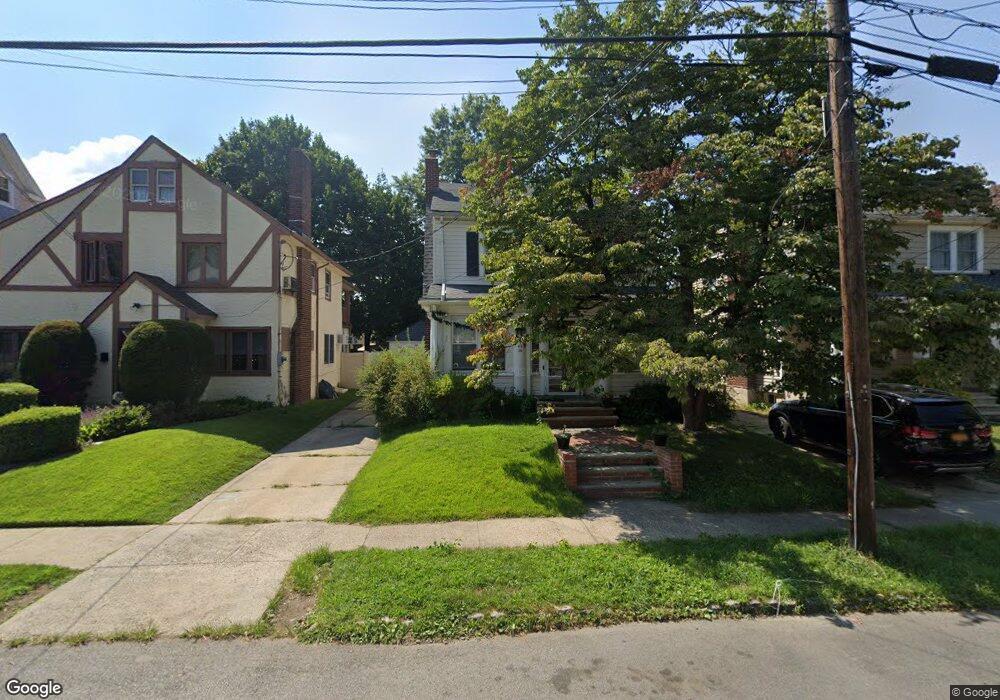
4336 170th St Flushing, NY 11358
East Flushing NeighborhoodEstimated Value: $1,094,000 - $1,219,000
5
Beds
4
Baths
1,998
Sq Ft
$591/Sq Ft
Est. Value
About This Home
This home is located at 4336 170th St, Flushing, NY 11358 and is currently estimated at $1,181,417, approximately $591 per square foot. 4336 170th St is a home located in Queens County with nearby schools including P.S. 107 Thomas A Dooley, I.S. 25 Adrien Block, and Francis Lewis High School.
Ownership History
Date
Name
Owned For
Owner Type
Purchase Details
Closed on
Sep 7, 2021
Sold by
Hao Ying and Pan Fan
Bought by
Qu Min and Xu Haibin
Current Estimated Value
Home Financials for this Owner
Home Financials are based on the most recent Mortgage that was taken out on this home.
Original Mortgage
$400,000
Outstanding Balance
$363,970
Interest Rate
2.8%
Mortgage Type
Purchase Money Mortgage
Estimated Equity
$817,447
Purchase Details
Closed on
Jun 17, 2014
Sold by
Hao Ying
Bought by
Hao Ying and Pan Fan
Purchase Details
Closed on
Oct 6, 2004
Sold by
Peters Frederick S
Bought by
Hao Ying
Home Financials for this Owner
Home Financials are based on the most recent Mortgage that was taken out on this home.
Original Mortgage
$498,960
Interest Rate
5.85%
Mortgage Type
Purchase Money Mortgage
Create a Home Valuation Report for This Property
The Home Valuation Report is an in-depth analysis detailing your home's value as well as a comparison with similar homes in the area
Home Values in the Area
Average Home Value in this Area
Purchase History
| Date | Buyer | Sale Price | Title Company |
|---|---|---|---|
| Qu Min | $1,039,800 | -- | |
| Hao Ying | -- | -- | |
| Hao Ying | $567,000 | -- |
Source: Public Records
Mortgage History
| Date | Status | Borrower | Loan Amount |
|---|---|---|---|
| Open | Qu Min | $400,000 | |
| Previous Owner | Hao Ying | $498,960 |
Source: Public Records
Tax History
| Year | Tax Paid | Tax Assessment Tax Assessment Total Assessment is a certain percentage of the fair market value that is determined by local assessors to be the total taxable value of land and additions on the property. | Land | Improvement |
|---|---|---|---|---|
| 2025 | $8,984 | $47,413 | $14,034 | $33,379 |
| 2024 | $8,984 | $44,730 | $13,387 | $31,343 |
| 2023 | $8,476 | $42,200 | $11,356 | $30,844 |
| 2022 | $7,948 | $56,400 | $17,760 | $38,640 |
| 2021 | $8,374 | $55,320 | $17,760 | $37,560 |
| 2020 | $8,363 | $54,720 | $17,760 | $36,960 |
| 2019 | $5,912 | $55,980 | $17,760 | $38,220 |
| 2018 | $7,169 | $35,167 | $13,519 | $21,648 |
| 2017 | $6,763 | $33,177 | $12,871 | $20,306 |
| 2016 | $6,629 | $33,177 | $12,871 | $20,306 |
| 2015 | $3,555 | $32,926 | $15,387 | $17,539 |
| 2014 | $3,555 | $31,063 | $15,674 | $15,389 |
Source: Public Records
Map
Nearby Homes
- 4328 168th St
- 4564 170th St
- 188-02 Northern Blvd
- 167-22 Northern Blvd
- 45-32 Utopia Pkwy
- 45-18 166th St
- 42-28 189th St
- 42-25 189th St
- 43-33 163rd St
- 163-02 45th Ave
- 4012 166th St
- 36-44 172 St Unit 93
- 45 24 171st St
- 171-06 Bagley Ave
- 3639 171st St Unit 26
- 36-35 171st St Unit 30
- 190-17 42nd Ave
- 43-58 163rd St
- 36-40 167th St
- 45-74 164th St
Your Personal Tour Guide
Ask me questions while you tour the home.