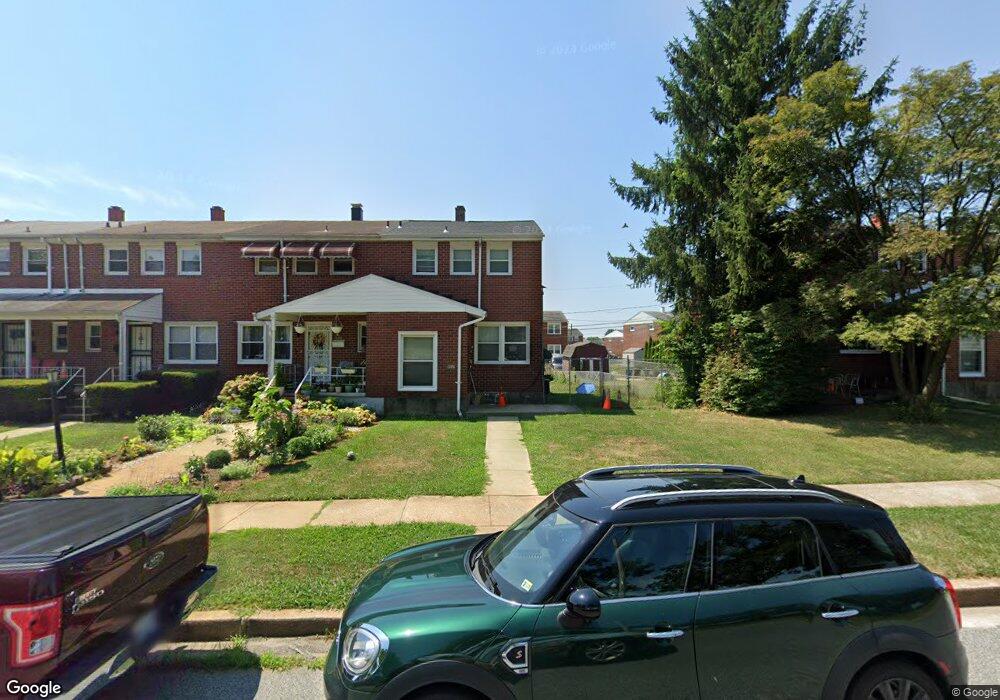
4337 Crest Heights Rd Baltimore, MD 21215
Estimated Value: $204,000 - $231,000
3
Beds
3
Baths
1,140
Sq Ft
$192/Sq Ft
Est. Value
About This Home
This home is located at 4337 Crest Heights Rd, Baltimore, MD 21215 and is currently estimated at $218,524, approximately $191 per square foot. 4337 Crest Heights Rd is a home located in Baltimore County with nearby schools including Milbrook Elementary, Pikesville Middle School, and Pikesville High School.
Ownership History
Date
Name
Owned For
Owner Type
Purchase Details
Closed on
Mar 30, 2011
Sold by
Simmons Kelly L
Bought by
Community Development Administrati
Current Estimated Value
Purchase Details
Closed on
Mar 17, 2011
Sold by
Simmons Kelly L
Bought by
Community Development Administrati
Purchase Details
Closed on
Jul 25, 2007
Sold by
Terry Lee and Terry Blackston
Bought by
Simmons Kelly L
Purchase Details
Closed on
Jul 12, 2007
Sold by
Terry Lee and Terry Blackston
Bought by
Simmons Kelly L
Purchase Details
Closed on
Aug 23, 2001
Sold by
Secretary Of Housing & Urban
Bought by
Terry Lee and Terry Blackston
Purchase Details
Closed on
May 24, 2001
Sold by
Curtis Dennis
Bought by
Secretary Of Housing & Urban
Purchase Details
Closed on
Jun 2, 1998
Sold by
Slade Realty No 3 Corp
Bought by
Curtis Dennis
Purchase Details
Closed on
Nov 10, 1997
Sold by
Lyon Steven David
Bought by
Slade Realty No 3 Corp
Create a Home Valuation Report for This Property
The Home Valuation Report is an in-depth analysis detailing your home's value as well as a comparison with similar homes in the area
Home Values in the Area
Average Home Value in this Area
Purchase History
| Date | Buyer | Sale Price | Title Company |
|---|---|---|---|
| Community Development Administrati | $167,020 | -- | |
| Community Development Administrati | $167,020 | -- | |
| Simmons Kelly L | $174,000 | -- | |
| Simmons Kelly L | $174,000 | -- | |
| Terry Lee | $81,250 | -- | |
| Secretary Of Housing & Urban | $96,900 | -- | |
| Curtis Dennis | $83,500 | -- | |
| Slade Realty No 3 Corp | $47,500 | -- |
Source: Public Records
Tax History Compared to Growth
Tax History
| Year | Tax Paid | Tax Assessment Tax Assessment Total Assessment is a certain percentage of the fair market value that is determined by local assessors to be the total taxable value of land and additions on the property. | Land | Improvement |
|---|---|---|---|---|
| 2025 | $3,128 | $180,900 | $47,000 | $133,900 |
| 2024 | $3,128 | $170,367 | $0 | $0 |
| 2023 | $2,657 | $159,833 | $0 | $0 |
| 2022 | $2,404 | $149,300 | $47,000 | $102,300 |
| 2021 | $2,415 | $144,800 | $0 | $0 |
| 2020 | $2,415 | $140,300 | $0 | $0 |
| 2019 | $2,547 | $135,800 | $47,000 | $88,800 |
| 2018 | $2,562 | $134,367 | $0 | $0 |
| 2017 | $2,449 | $132,933 | $0 | $0 |
| 2016 | $2,280 | $131,500 | $0 | $0 |
| 2015 | $2,280 | $131,500 | $0 | $0 |
| 2014 | $2,280 | $131,500 | $0 | $0 |
Source: Public Records
Map
Nearby Homes
- 7023 Concord Rd
- 7004 Alden Rd
- 4209 Lowell Dr
- 4115 Old Milford Mill Rd
- 6811 Parsons Ave
- 7039 Surrey Dr
- 503 Nassau St
- 6700 Parsons Ave
- 6705 Fairmount Ave
- 3702 Kingwood Square
- 3711 Seven Mile Ln
- 4348 Danlou Dr
- 6603 Fairmount Ave
- 6509 Parr Ave
- 3631 Glengyle Ave
- 6603 Mount Vernon Ave
- 306 Upland Rd
- 702 Westover Rd
- 130 Slade Ave Unit 411
- 130 Slade Ave Unit 208
- 4335 Crest Heights Rd
- 4339 Crest Heights Rd
- 4333 Crest Heights Rd
- 4341 Crest Heights Rd
- 4331 Crest Heights Rd
- 4343 Crest Heights Rd
- 4329 Crest Heights Rd
- 4345 Crest Heights Rd
- 4327 Crest Heights Rd
- 4347 Crest Heights Rd
- 6935 Blanche Rd
- 6933 Blanche Rd
- 6931 Blanche Rd
- 6937 Blanche Rd
- 4349 Crest Heights Rd
- 4325 Crest Heights Rd
- 4325 Crest Heights Rd
- 6929 Blanche Rd
- 6939 Blanche Rd
- 6927 Blanche Rd