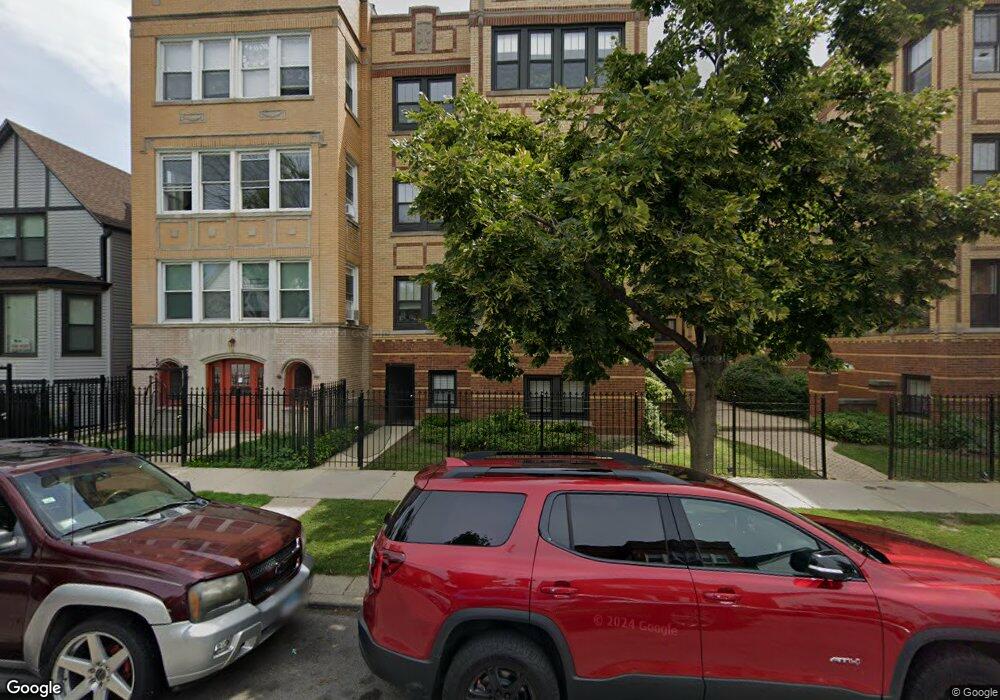
4337 N Troy St Unit 43371E Chicago, IL 60618
Irving Park NeighborhoodEstimated Value: $236,000 - $264,000
2
Beds
1
Bath
800
Sq Ft
$309/Sq Ft
Est. Value
About This Home
This home is located at 4337 N Troy St Unit 43371E, Chicago, IL 60618 and is currently estimated at $247,491, approximately $309 per square foot. 4337 N Troy St Unit 43371E is a home located in Cook County with nearby schools including Bateman Elementary School and Roosevelt High School.
Ownership History
Date
Name
Owned For
Owner Type
Purchase Details
Closed on
Jan 3, 2019
Sold by
Federal National Mortgage Association
Bought by
Montesino Max
Current Estimated Value
Home Financials for this Owner
Home Financials are based on the most recent Mortgage that was taken out on this home.
Original Mortgage
$133,200
Outstanding Balance
$117,743
Interest Rate
4.87%
Mortgage Type
New Conventional
Estimated Equity
$129,748
Purchase Details
Closed on
Nov 8, 2017
Sold by
Thrasher Christine M and Pnc Bank
Bought by
Federal National Mortgage Association
Purchase Details
Closed on
Feb 19, 2008
Sold by
4333 North Troy Llc
Bought by
Thrasher Christine
Home Financials for this Owner
Home Financials are based on the most recent Mortgage that was taken out on this home.
Original Mortgage
$185,500
Interest Rate
5.75%
Mortgage Type
Purchase Money Mortgage
Create a Home Valuation Report for This Property
The Home Valuation Report is an in-depth analysis detailing your home's value as well as a comparison with similar homes in the area
Home Values in the Area
Average Home Value in this Area
Purchase History
| Date | Buyer | Sale Price | Title Company |
|---|---|---|---|
| Montesino Max | $148,000 | Attorneys Title Guaranty Fu | |
| Federal National Mortgage Association | -- | Attorney | |
| Thrasher Christine | $185,000 | Ctic |
Source: Public Records
Mortgage History
| Date | Status | Borrower | Loan Amount |
|---|---|---|---|
| Open | Montesino Max | $133,200 | |
| Previous Owner | Thrasher Christine | $185,500 |
Source: Public Records
Tax History Compared to Growth
Tax History
| Year | Tax Paid | Tax Assessment Tax Assessment Total Assessment is a certain percentage of the fair market value that is determined by local assessors to be the total taxable value of land and additions on the property. | Land | Improvement |
|---|---|---|---|---|
| 2024 | $3,388 | $17,544 | $2,952 | $14,592 |
| 2023 | $3,302 | $16,000 | $2,380 | $13,620 |
| 2022 | $3,302 | $16,000 | $2,380 | $13,620 |
| 2021 | $3,228 | $15,999 | $2,380 | $13,619 |
| 2020 | $2,779 | $12,430 | $1,047 | $11,383 |
| 2019 | $2,099 | $13,841 | $1,047 | $12,794 |
| 2018 | $2,546 | $16,284 | $1,047 | $15,237 |
| 2017 | $2,527 | $15,074 | $952 | $14,122 |
| 2016 | $2,915 | $17,001 | $952 | $16,049 |
| 2015 | $2,644 | $17,001 | $952 | $16,049 |
| 2014 | $2,077 | $13,720 | $856 | $12,864 |
| 2013 | $2,024 | $13,720 | $856 | $12,864 |
Source: Public Records
Map
Nearby Homes
- 4333 N Troy St Unit 3E
- 4410 N Troy St Unit 101
- 4316 N Albany Ave Unit 1
- 4438 N Kedzie Ave Unit G-1
- 4231 N Kedzie Ave Unit 3E
- 3055 W Sunnyside Ave Unit 1
- 4229 N Kedzie Ave
- 4437 N Whipple St
- 4248 N Sawyer Ave
- 4411 N Sacramento Ave Unit 1
- 4343 N Sacramento Ave Unit A-G
- 3102 W Berteau Ave Unit 31023
- 3222 W Berteau Ave Unit 2
- 4141 N Kedzie Ave Unit 307
- 4347 N Richmond St Unit 1N
- 4347 N Richmond St Unit 1S
- 4347 N Richmond St Unit 3N
- 4347 N Richmond St Unit 2N
- 4343 N Richmond St Unit 1S
- 3247 W Berteau Ave
- 4335 N Troy St Unit 3S
- 4333 N Troy St Unit 1W
- 4335 N Troy St Unit 43352N
- 4335 N Troy St Unit 43353N
- 4335 N Troy St Unit 43353S
- 4335 N Troy St Unit 43352S
- 4333 N Troy St Unit 43333E
- 4333 N Troy St Unit 43331W
- 4333 N Troy St Unit 43333W
- 4335 N Troy St Unit 43351S
- 4333 N Troy St Unit 43332W
- 4333 N Troy St Unit 4333GW
- 4335 N Troy St Unit 43351N
- 4333 N Troy St Unit 43332E
- 4333 N Troy St Unit 43331E
- 4335 N Troy St Unit 2N
- 4335 N Troy St Unit 3N
- 4333 N Troy St Unit GW
- 4335 N Troy St Unit 1N
- 4333 N Troy St Unit 2E