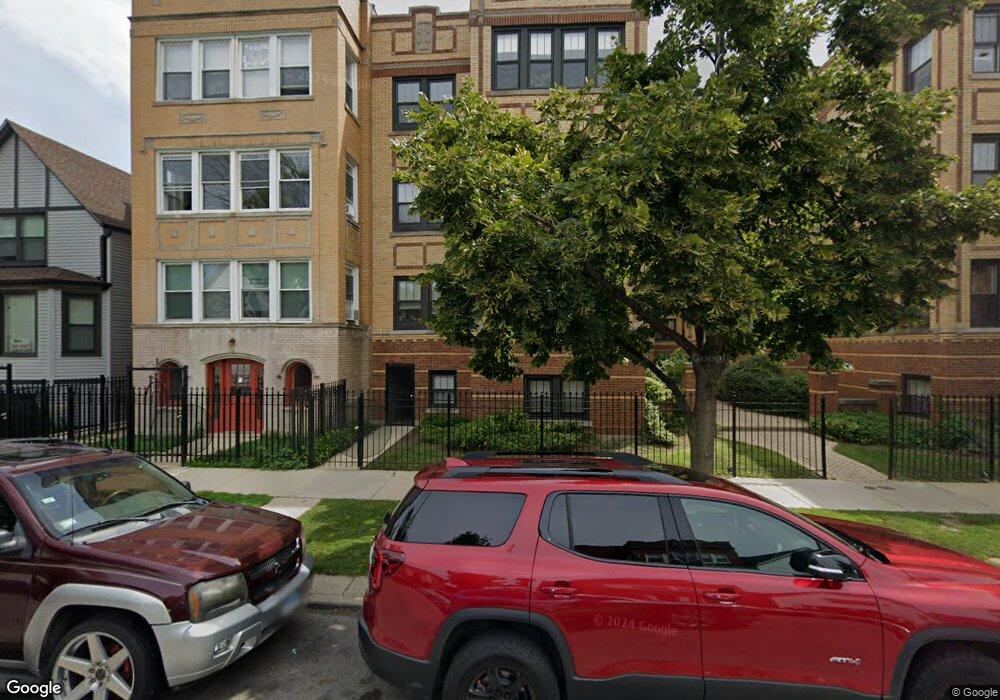
4337 N Troy St Unit 43372W Chicago, IL 60618
Irving Park NeighborhoodEstimated Value: $242,000 - $249,670
2
Beds
1
Bath
800
Sq Ft
$306/Sq Ft
Est. Value
About This Home
This home is located at 4337 N Troy St Unit 43372W, Chicago, IL 60618 and is currently estimated at $244,668, approximately $305 per square foot. 4337 N Troy St Unit 43372W is a home located in Cook County with nearby schools including Bateman Elementary School and Roosevelt High School.
Ownership History
Date
Name
Owned For
Owner Type
Purchase Details
Closed on
Feb 11, 2025
Sold by
Auctioncom Llc
Bought by
Gjr Investments Llc
Current Estimated Value
Purchase Details
Closed on
May 12, 2016
Sold by
Windycity Holdings Llc
Bought by
Oneill Kevin
Home Financials for this Owner
Home Financials are based on the most recent Mortgage that was taken out on this home.
Original Mortgage
$126,000
Interest Rate
3.75%
Mortgage Type
New Conventional
Purchase Details
Closed on
Mar 7, 2016
Sold by
Secretary Of Housing & Urban Development
Bought by
Windycity Holdings Llc
Purchase Details
Closed on
May 14, 2012
Sold by
Burns Brett
Bought by
The Secretary Of Housing & Urban Develop
Purchase Details
Closed on
Sep 6, 2006
Sold by
4333 North Troy Llc
Bought by
Burns Brett M and Burns Melissa
Home Financials for this Owner
Home Financials are based on the most recent Mortgage that was taken out on this home.
Original Mortgage
$214,900
Interest Rate
6.49%
Mortgage Type
Unknown
Create a Home Valuation Report for This Property
The Home Valuation Report is an in-depth analysis detailing your home's value as well as a comparison with similar homes in the area
Home Values in the Area
Average Home Value in this Area
Purchase History
| Date | Buyer | Sale Price | Title Company |
|---|---|---|---|
| Gjr Investments Llc | $160,500 | None Listed On Document | |
| Oneill Kevin | $140,000 | First American Title | |
| Windycity Holdings Llc | -- | First American Title Ins Co | |
| The Secretary Of Housing & Urban Develop | -- | None Available | |
| Burns Brett M | $215,000 | Cti |
Source: Public Records
Mortgage History
| Date | Status | Borrower | Loan Amount |
|---|---|---|---|
| Previous Owner | Oneill Kevin | $126,000 | |
| Previous Owner | Burns Brett M | $214,900 |
Source: Public Records
Tax History Compared to Growth
Tax History
| Year | Tax Paid | Tax Assessment Tax Assessment Total Assessment is a certain percentage of the fair market value that is determined by local assessors to be the total taxable value of land and additions on the property. | Land | Improvement |
|---|---|---|---|---|
| 2024 | $2,686 | $18,085 | $3,043 | $15,042 |
| 2023 | $2,596 | $16,000 | $2,454 | $13,546 |
| 2022 | $2,596 | $16,000 | $2,454 | $13,546 |
| 2021 | $2,556 | $15,999 | $2,453 | $13,546 |
| 2020 | $2,171 | $12,813 | $1,079 | $11,734 |
| 2019 | $2,185 | $14,268 | $1,079 | $13,189 |
| 2018 | $2,646 | $16,786 | $1,079 | $15,707 |
| 2017 | $4,731 | $21,906 | $981 | $20,925 |
| 2016 | $3,900 | $21,906 | $981 | $20,925 |
| 2015 | $3,546 | $21,906 | $981 | $20,925 |
| 2014 | $2,814 | $17,680 | $883 | $16,797 |
| 2013 | $2,747 | $17,680 | $883 | $16,797 |
Source: Public Records
Map
Nearby Homes
- 4333 N Troy St Unit 3E
- 4316 N Albany Ave Unit 1
- 4410 N Troy St Unit 101
- 4438 N Kedzie Ave Unit G-1
- 4231 N Kedzie Ave Unit 3E
- 4229 N Kedzie Ave
- 3055 W Sunnyside Ave Unit 1
- 4437 N Whipple St
- 4248 N Sawyer Ave
- 4411 N Sacramento Ave Unit 1
- 4343 N Sacramento Ave Unit A-G
- 3102 W Berteau Ave Unit 31023
- 3222 W Berteau Ave Unit 2
- 4347 N Richmond St Unit 1N
- 4347 N Richmond St Unit 1S
- 4347 N Richmond St Unit 3N
- 4347 N Richmond St Unit 2N
- 4141 N Kedzie Ave Unit 307
- 4343 N Richmond St Unit 1S
- 3247 W Berteau Ave
- 4335 N Troy St Unit 3S
- 4333 N Troy St Unit 1W
- 4335 N Troy St Unit 43352N
- 4335 N Troy St Unit 43353N
- 4335 N Troy St Unit 43353S
- 4335 N Troy St Unit 43352S
- 4333 N Troy St Unit 43333E
- 4333 N Troy St Unit 43331W
- 4333 N Troy St Unit 43333W
- 4335 N Troy St Unit 43351S
- 4333 N Troy St Unit 43332W
- 4333 N Troy St Unit 4333GW
- 4335 N Troy St Unit 43351N
- 4333 N Troy St Unit 43332E
- 4333 N Troy St Unit 43331E
- 4335 N Troy St Unit 2N
- 4335 N Troy St Unit 3N
- 4333 N Troy St Unit GW
- 4335 N Troy St Unit 1N
- 4333 N Troy St Unit 2E