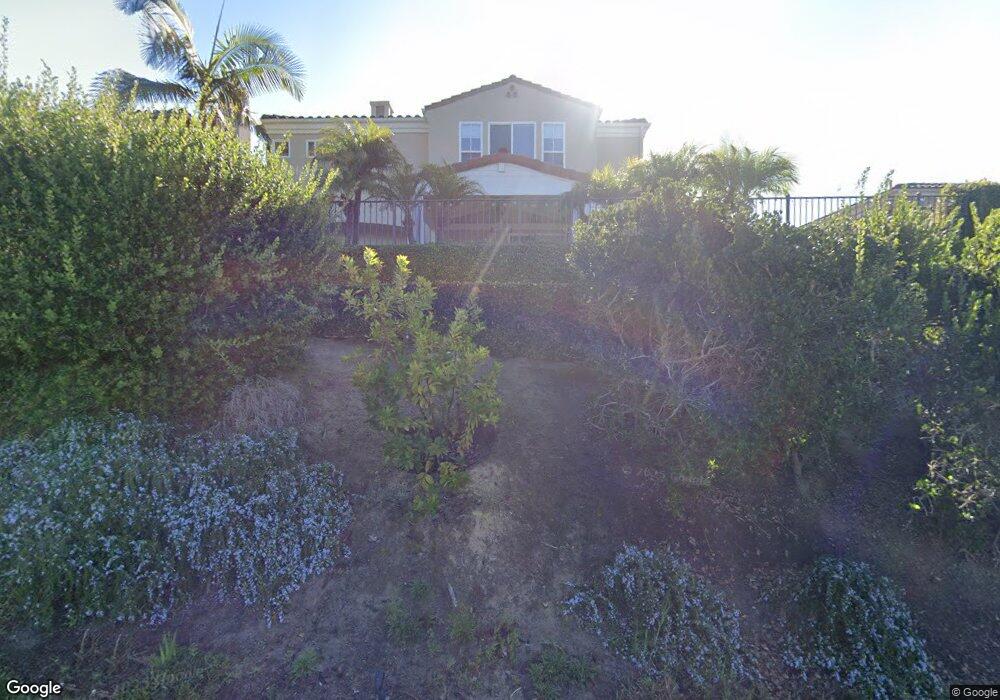
4338 Philbrook Square San Diego, CA 92130
Carmel Valley NeighborhoodEstimated Value: $2,836,258 - $3,229,000
5
Beds
6
Baths
4,327
Sq Ft
$706/Sq Ft
Est. Value
About This Home
This home is located at 4338 Philbrook Square, San Diego, CA 92130 and is currently estimated at $3,054,565, approximately $705 per square foot. 4338 Philbrook Square is a home located in San Diego County with nearby schools including Ocean Air Elementary School, Carmel Valley Middle School, and Torrey Hills High School.
Ownership History
Date
Name
Owned For
Owner Type
Purchase Details
Closed on
Jul 6, 2011
Sold by
Mohager Ali K and Mohager Parisa F
Bought by
Mohager Ali K and Mohager Parisa F
Current Estimated Value
Home Financials for this Owner
Home Financials are based on the most recent Mortgage that was taken out on this home.
Original Mortgage
$999,900
Outstanding Balance
$687,577
Interest Rate
4.5%
Mortgage Type
New Conventional
Estimated Equity
$2,366,988
Purchase Details
Closed on
Feb 2, 2011
Sold by
Mohager Ali K and Mohager Parisa F
Bought by
Mohager Ali K and Mohager Parisa F
Purchase Details
Closed on
Jan 12, 2001
Sold by
Torrey Pines Homebuilding Company Llc
Bought by
Mohager Ali K and Mohager Parisa F
Home Financials for this Owner
Home Financials are based on the most recent Mortgage that was taken out on this home.
Original Mortgage
$627,400
Interest Rate
7.15%
Create a Home Valuation Report for This Property
The Home Valuation Report is an in-depth analysis detailing your home's value as well as a comparison with similar homes in the area
Home Values in the Area
Average Home Value in this Area
Purchase History
| Date | Buyer | Sale Price | Title Company |
|---|---|---|---|
| Mohager Ali K | -- | Accommodation | |
| Mohager Ali K | -- | First American Title Company | |
| Mohager Ali K | -- | None Available | |
| Mohager Ali K | $784,500 | First American Title Ins Co |
Source: Public Records
Mortgage History
| Date | Status | Borrower | Loan Amount |
|---|---|---|---|
| Open | Mohager Ali K | $999,900 | |
| Previous Owner | Mohager Ali K | $627,400 |
Source: Public Records
Tax History Compared to Growth
Tax History
| Year | Tax Paid | Tax Assessment Tax Assessment Total Assessment is a certain percentage of the fair market value that is determined by local assessors to be the total taxable value of land and additions on the property. | Land | Improvement |
|---|---|---|---|---|
| 2025 | $13,414 | $1,181,883 | $376,701 | $805,182 |
| 2024 | $13,414 | $1,158,710 | $369,315 | $789,395 |
| 2023 | $13,314 | $1,135,991 | $362,074 | $773,917 |
| 2022 | $13,120 | $1,113,718 | $354,975 | $758,743 |
| 2021 | $12,681 | $1,091,881 | $348,015 | $743,866 |
| 2020 | $12,782 | $1,080,686 | $344,447 | $736,239 |
| 2019 | $12,553 | $1,059,497 | $337,694 | $721,803 |
| 2018 | $12,052 | $1,038,723 | $331,073 | $707,650 |
| 2017 | $11,846 | $1,018,357 | $324,582 | $693,775 |
| 2016 | $11,497 | $998,390 | $318,218 | $680,172 |
| 2015 | $11,342 | $983,395 | $313,439 | $669,956 |
| 2014 | $11,133 | $964,133 | $307,300 | $656,833 |
Source: Public Records
Map
Nearby Homes
- 0 Arroyo Sorrento Place Unit 250030141
- 11649 Thistle Hill Place
- 3854-56 Via Del Mar
- 4 Via Del Mar
- 3 Via Del Mar
- 3811 Via Del Mar
- 3738 Ruette San Raphael
- 11280 Carmel Creek Rd
- 11325 Carmel Creek Rd
- 4289 Calle Isabelino
- 3975 San Gregorio Way
- 3767 Torrey View Ct
- 3714 Carmel View Rd
- 12233 Caminito Del Mar Sands
- 3672 Caminito Carmel Landing
- 3602 Caminito Carmel Landing Unit 125
- 12165 Caminito Mira Del Mar
- 13563 Caminito Carmel
- 12229 Carmel Vista Rd Unit 250
- 12213 Carmel Vista Rd Unit 234
- 4358 Philbrook Square
- 4318 Philbrook Square
- 4378 Philbrook Square
- 4298 Philbrook Square
- 4278 Philbrook Square
- 11602 Parkhurst Square
- 11596 Parkhurst Square
- 11608 Parkhurst Square
- 11590 Parkhurst Square
- 4258 Philbrook Square
- 11584 Parkhurst Square
- 11614 Parkhurst Square
- 4408 Philbrook Square
- 4238 Philbrook Square
- 11620 Parkhurst Square
- 4004 Arroyo Sorrento Place
- 11578 Parkhurst Square
- 4218 Philbrook Square
- 11572 Parkhurst Square
- 4428 Philbrook Square