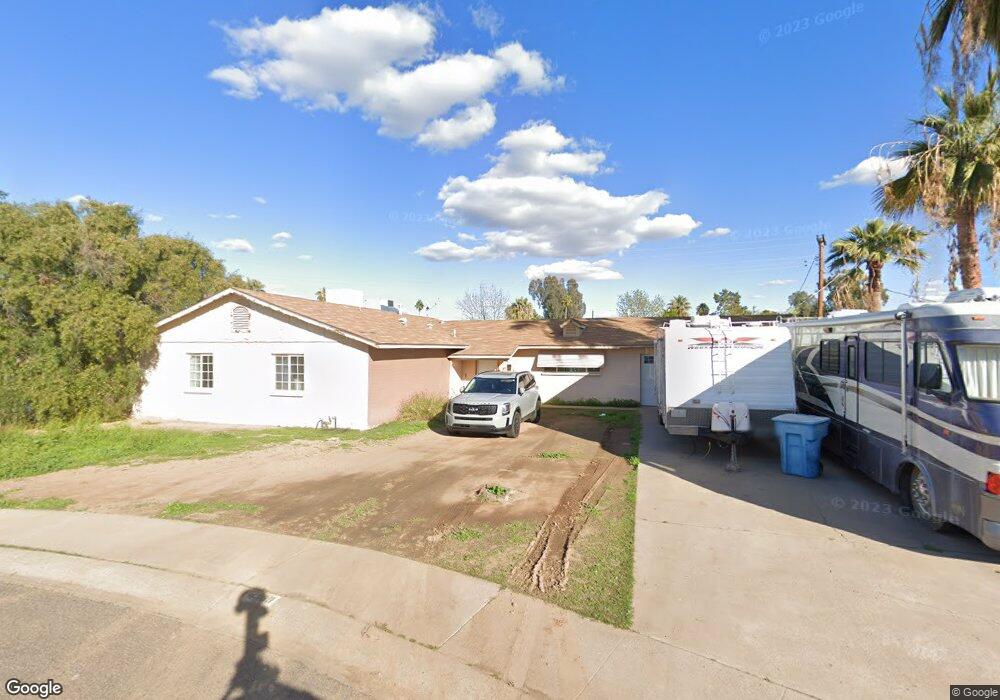
4339 N 64th Ave Phoenix, AZ 85033
Estimated Value: $318,000 - $399,000
Studio
2
Baths
1,913
Sq Ft
$186/Sq Ft
Est. Value
About This Home
This home is located at 4339 N 64th Ave, Phoenix, AZ 85033 and is currently estimated at $356,040, approximately $186 per square foot. 4339 N 64th Ave is a home located in Maricopa County with nearby schools including Holiday Park School, Desert Sands Middle School, and Trevor Browne High School.
Ownership History
Date
Name
Owned For
Owner Type
Purchase Details
Closed on
Sep 28, 2005
Sold by
Whittington Eric S
Bought by
Bauer Charles F and Famil Mary Jo Bauer
Current Estimated Value
Purchase Details
Closed on
Jan 24, 2003
Sold by
Charles F Jr & Mary Jo Bauer Family Lp
Bought by
Bauer Mary Jo
Home Financials for this Owner
Home Financials are based on the most recent Mortgage that was taken out on this home.
Original Mortgage
$71,361
Interest Rate
5.82%
Mortgage Type
VA
Purchase Details
Closed on
Mar 10, 1999
Sold by
Bauer Charles F and Bauer Mary Jo
Bought by
The Charles F Bauer Jr & Mary Jo Bauer F
Purchase Details
Closed on
Oct 31, 1996
Sold by
Butcher Jerry W and Butcher Leta J
Bought by
Bauer Charles and Bauer Charles F
Home Financials for this Owner
Home Financials are based on the most recent Mortgage that was taken out on this home.
Original Mortgage
$71,400
Interest Rate
7.81%
Mortgage Type
VA
Create a Home Valuation Report for This Property
The Home Valuation Report is an in-depth analysis detailing your home's value as well as a comparison with similar homes in the area
Purchase History
| Date | Buyer | Sale Price | Title Company |
|---|---|---|---|
| Bauer Charles F | -- | -- | |
| Bauer Mary Jo | -- | Capital Title Agency Inc | |
| The Charles F Bauer Jr & Mary Jo Bauer F | -- | -- | |
| Bauer Charles | $70,000 | North American Title Agency |
Source: Public Records
Mortgage History
| Date | Status | Borrower | Loan Amount |
|---|---|---|---|
| Previous Owner | Bauer Mary Jo | $71,361 | |
| Previous Owner | Bauer Charles | $71,400 |
Source: Public Records
Tax History
| Year | Tax Paid | Tax Assessment Tax Assessment Total Assessment is a certain percentage of the fair market value that is determined by local assessors to be the total taxable value of land and additions on the property. | Land | Improvement |
|---|---|---|---|---|
| 2025 | $1,393 | $7,958 | -- | -- |
| 2024 | $1,385 | $7,579 | -- | -- |
| 2023 | $1,385 | $26,350 | $5,270 | $21,080 |
| 2022 | $1,306 | $21,080 | $4,210 | $16,870 |
| 2021 | $1,322 | $18,920 | $3,780 | $15,140 |
| 2020 | $1,253 | $17,380 | $3,470 | $13,910 |
| 2019 | $1,199 | $15,300 | $3,060 | $12,240 |
| 2018 | $1,247 | $13,920 | $2,780 | $11,140 |
| 2017 | $1,206 | $11,810 | $2,360 | $9,450 |
| 2016 | $1,153 | $10,100 | $2,020 | $8,080 |
| 2015 | $959 | $8,720 | $1,740 | $6,980 |
Source: Public Records
Map
Nearby Homes
- 6530 W Turney Ave
- 4116 N 64th Dr
- 4545 N 67th Ave Unit 1422
- 4545 N 67th Ave Unit 1058
- 4545 N 67th Ave Unit 1439
- 4545 N 67th Ave Unit 1028
- 4545 N 67th Ave Unit 1211
- 4545 N 67th Ave Unit 2420
- 4545 N 67th Ave Unit 1134
- 6437 W College Dr
- 6218 W Wolf St
- 4233 N 68th Ave Unit 430
- 6217 W Fairmount Ave
- 4709 N 62nd Ave
- 6806 W Devonshire Ave
- 3802 N 62nd Dr
- 4267 N 68th Ln Unit 504
- 6817 W Devonshire Ave Unit 311
- 4333 N 59th Ave
- 6201 W Indianola Ave
- 4333 N 64th Ave
- 6402 W Roma Ave Unit 3
- 4340 N 63rd Dr
- 4402 N 63rd Dr
- 4334 N 63rd Dr
- 6401 W Roma Ave
- 6331 W Sells Dr
- 4325 N 64th Ave
- 6406 W Roma Ave
- 6339 W Sells Dr
- 4326 N 63rd Dr
- 6402 W Turney Ave
- 6401 W Sells Dr
- 6409 W Roma Ave
- 4339 N 63rd Dr
- 4401 N 63rd Dr
- 4317 N 64th Ave
- 6412 W Roma Ave
- 4320 N 63rd Dr
Your Personal Tour Guide
Ask me questions while you tour the home.