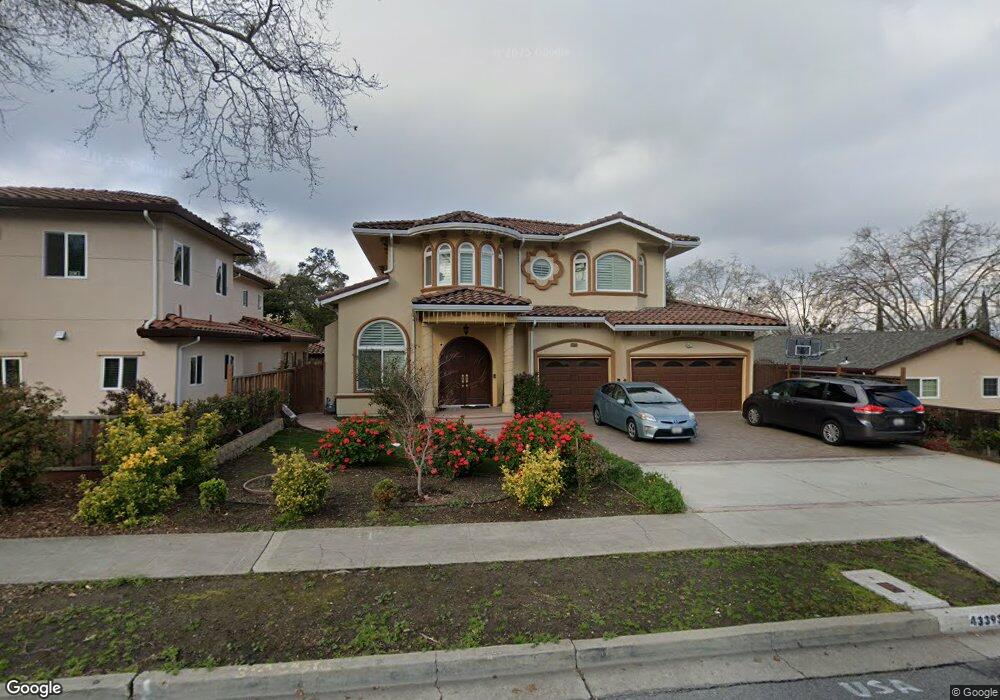
43393 Bryant St Fremont, CA 94539
Mission San Jose NeighborhoodEstimated Value: $3,146,000 - $3,901,000
2
Beds
1
Bath
4,005
Sq Ft
$880/Sq Ft
Est. Value
About This Home
This home is located at 43393 Bryant St, Fremont, CA 94539 and is currently estimated at $3,524,628, approximately $880 per square foot. 43393 Bryant St is a home located in Alameda County with nearby schools including Mission San Jose Elementary School, William Hopkins Junior High School, and Mission San Jose High School.
Ownership History
Date
Name
Owned For
Owner Type
Purchase Details
Closed on
Apr 10, 2015
Sold by
Jonnadula Ravi and Jonnadula Pavani
Bought by
Jonnadula Ravi and Jonnadula Pavani
Current Estimated Value
Home Financials for this Owner
Home Financials are based on the most recent Mortgage that was taken out on this home.
Original Mortgage
$1,100,000
Outstanding Balance
$819,191
Interest Rate
2.87%
Mortgage Type
Adjustable Rate Mortgage/ARM
Estimated Equity
$2,705,437
Purchase Details
Closed on
Oct 11, 2012
Sold by
Lewis Leslie B
Bought by
Jonnadula Ravi K and Jonnadula Pavani
Home Financials for this Owner
Home Financials are based on the most recent Mortgage that was taken out on this home.
Original Mortgage
$540,000
Interest Rate
3.52%
Mortgage Type
New Conventional
Purchase Details
Closed on
May 21, 2010
Sold by
Lewis Leslie Brook
Bought by
Lewis Leslie B
Purchase Details
Closed on
Feb 28, 2008
Sold by
Amaral Gloria M
Bought by
Lewis Leslie Brook
Purchase Details
Closed on
Jul 14, 2004
Sold by
Amaral Gloria A
Bought by
Amaral Gloria M
Purchase Details
Closed on
May 12, 1995
Sold by
Amaral John M
Bought by
Amaral John M and Amaral Gloria M
Create a Home Valuation Report for This Property
The Home Valuation Report is an in-depth analysis detailing your home's value as well as a comparison with similar homes in the area
Home Values in the Area
Average Home Value in this Area
Purchase History
| Date | Buyer | Sale Price | Title Company |
|---|---|---|---|
| Jonnadula Ravi | -- | Fidelity National Title Co | |
| Jonnadula Ravi K | $675,000 | Chicago Title Company | |
| Lewis Leslie B | -- | None Available | |
| Lewis Leslie Brook | -- | None Available | |
| Amaral Gloria M | -- | -- | |
| Amaral John M | -- | -- |
Source: Public Records
Mortgage History
| Date | Status | Borrower | Loan Amount |
|---|---|---|---|
| Open | Jonnadula Ravi | $1,100,000 | |
| Closed | Jonnadula Ravi K | $540,000 |
Source: Public Records
Tax History Compared to Growth
Tax History
| Year | Tax Paid | Tax Assessment Tax Assessment Total Assessment is a certain percentage of the fair market value that is determined by local assessors to be the total taxable value of land and additions on the property. | Land | Improvement |
|---|---|---|---|---|
| 2025 | $22,374 | $1,940,431 | $615,690 | $1,331,741 |
| 2024 | $22,374 | $1,902,250 | $603,620 | $1,305,630 |
| 2023 | $21,804 | $1,871,821 | $591,785 | $1,280,036 |
| 2022 | $21,564 | $1,828,122 | $580,185 | $1,254,937 |
| 2021 | $21,023 | $1,792,143 | $568,810 | $1,230,333 |
| 2020 | $21,220 | $1,780,702 | $562,980 | $1,217,722 |
| 2019 | $21,014 | $1,745,795 | $551,945 | $1,193,850 |
| 2018 | $25,178 | $2,101,725 | $541,125 | $1,560,600 |
| 2017 | $24,547 | $2,060,515 | $530,515 | $1,530,000 |
| 2016 | $24,162 | $2,020,115 | $520,115 | $1,500,000 |
| 2015 | $9,853 | $797,305 | $512,305 | $285,000 |
| 2014 | $6,373 | $502,270 | $502,270 | $0 |
Source: Public Records
Map
Nearby Homes
- 43382 Bryant St
- 341 Dana St
- 43547 Ellsworth St
- 43150 Starr St
- 483 Becado Place
- 335 Via Rosario
- 42965 Corte Verde
- 42955 Corte Verde
- 138 Telles Ln
- 905 Glenhill Dr
- 124 Linmore Dr
- 646 Bella Vista Ct
- 42099 Vinha Way
- 43555 Puesta Del Sol
- 379 Felipe Common
- 2164 Ocaso Camino
- 42329 Troyer Ave
- 44423 View Point Cir
- 2225 Valorie St
- 1224 Bedford St