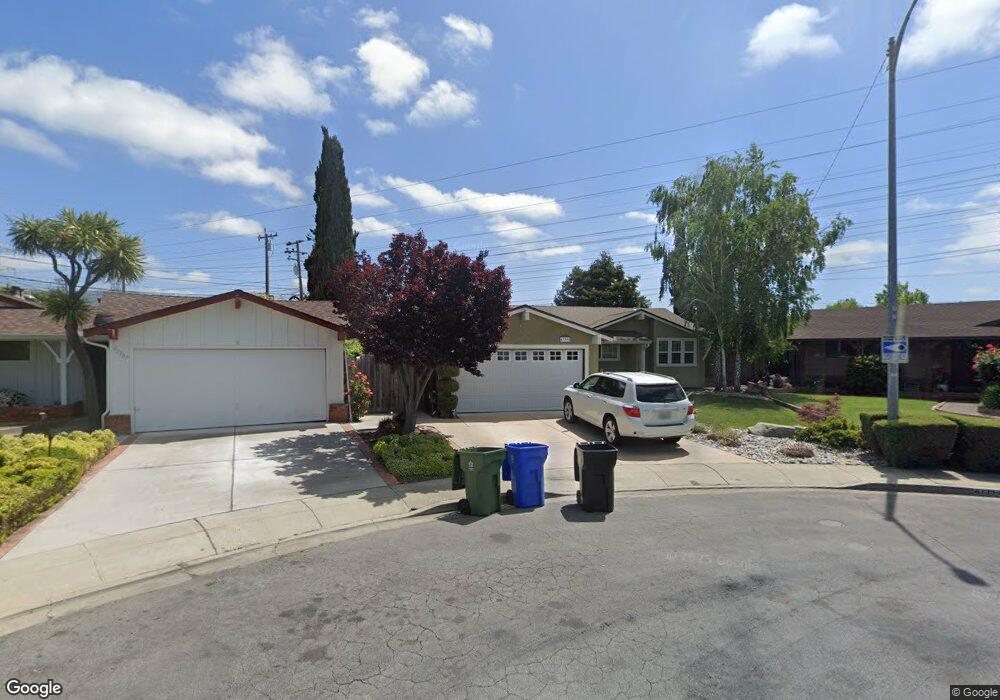
43395 Castle Park Ct Fremont, CA 94538
Blacow NeighborhoodEstimated Value: $1,387,000 - $1,623,000
3
Beds
2
Baths
1,535
Sq Ft
$1,000/Sq Ft
Est. Value
About This Home
This home is located at 43395 Castle Park Ct, Fremont, CA 94538 and is currently estimated at $1,535,589, approximately $1,000 per square foot. 43395 Castle Park Ct is a home located in Alameda County with nearby schools including Steven Millard Elementary, G.M. Walters Middle School, and John F. Kennedy High School.
Ownership History
Date
Name
Owned For
Owner Type
Purchase Details
Closed on
Apr 23, 1998
Sold by
Dodds Robert and Dodds Gloria
Bought by
Hernandez Jose M and Hernandez Tammy J
Current Estimated Value
Home Financials for this Owner
Home Financials are based on the most recent Mortgage that was taken out on this home.
Original Mortgage
$173,600
Outstanding Balance
$35,189
Interest Rate
7.87%
Estimated Equity
$1,500,400
Create a Home Valuation Report for This Property
The Home Valuation Report is an in-depth analysis detailing your home's value as well as a comparison with similar homes in the area
Home Values in the Area
Average Home Value in this Area
Purchase History
| Date | Buyer | Sale Price | Title Company |
|---|---|---|---|
| Hernandez Jose M | $217,000 | Old Republic Title Company |
Source: Public Records
Mortgage History
| Date | Status | Borrower | Loan Amount |
|---|---|---|---|
| Open | Hernandez Jose M | $173,600 | |
| Closed | Hernandez Jose M | $21,700 |
Source: Public Records
Tax History Compared to Growth
Tax History
| Year | Tax Paid | Tax Assessment Tax Assessment Total Assessment is a certain percentage of the fair market value that is determined by local assessors to be the total taxable value of land and additions on the property. | Land | Improvement |
|---|---|---|---|---|
| 2025 | $4,753 | $353,641 | $103,943 | $256,698 |
| 2024 | $4,753 | $346,571 | $101,905 | $251,666 |
| 2023 | $4,612 | $346,639 | $99,907 | $246,732 |
| 2022 | $4,532 | $332,842 | $97,948 | $241,894 |
| 2021 | $4,426 | $326,180 | $96,028 | $237,152 |
| 2020 | $4,376 | $329,765 | $95,044 | $234,721 |
| 2019 | $4,329 | $323,300 | $93,180 | $230,120 |
| 2018 | $4,241 | $316,962 | $91,354 | $225,608 |
| 2017 | $4,135 | $310,748 | $89,563 | $221,185 |
| 2016 | $4,054 | $304,656 | $87,807 | $216,849 |
| 2015 | $3,990 | $300,080 | $86,488 | $213,592 |
| 2014 | $3,914 | $294,203 | $84,794 | $209,409 |
Source: Public Records
Map
Nearby Homes
- 43163 Grimmer Terrace
- 48 Eagle Green
- 92 Delta Green
- 42932 Peachwood St
- 202 Manitoba Terrace
- 208 Manitoba Terrace
- 262 Manitoba Green
- 257 Manitoba Green
- 261 Manitoba Green Unit 261
- 4860 Bryce Canyon Park Dr
- 5560 Boscell Common
- 4537 Capewood Terrace
- 4533 Capewood Terrace
- 4309 Bora Ave
- 5341 Audubon Park Ct
- 41882 Gifford St
- 42759 Newport Dr
- 4751 Wadsworth Ct
- 40696 Robin St
- 3923 Wildflower Common Unit 19
- 43387 Castle Park Ct
- 43394 Castle Park Ct
- 43375 Castle Park Ct
- 43386 Castle Park Ct
- 43374 Castle Park Ct
- 43363 Castle Park Ct
- 43362 Castle Park Ct
- 43399 Isle Royal St
- 43385 Isle Royal St
- 43351 Castle Park Ct
- 43373 Isle Royal St
- 4662 Montmartre Park Ct
- 43350 Castle Park Ct
- 4656 Montmartre Park Ct
- 43361 Isle Royal St
- 4668 Montmartre Park Ct
- 43339 Castle Park Ct
- 4674 Montmartre Park Ct
- 43338 Castle Park Ct
- 43349 Isle Royal St