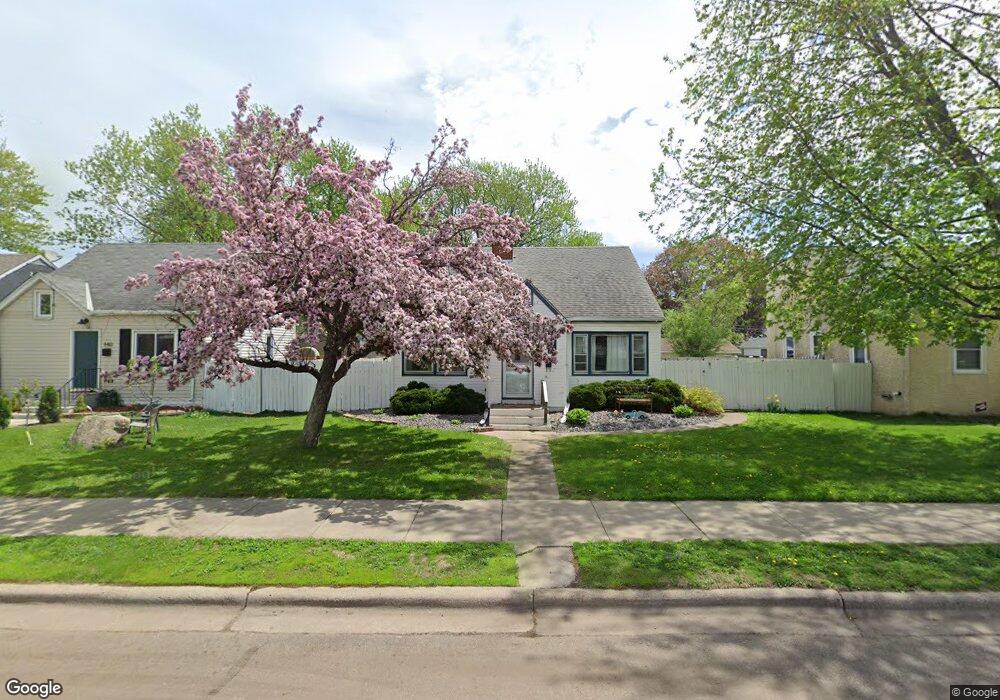
434 434 15th-Avenue-n South St. Paul, MN 55075
Estimated Value: $346,000 - $391,000
5
Beds
3
Baths
1,472
Sq Ft
$248/Sq Ft
Est. Value
About This Home
This home is located at 434 434 15th-Avenue-n, South St. Paul, MN 55075 and is currently estimated at $364,709, approximately $247 per square foot. 434 434 15th-Avenue-n is a home located in Dakota County with nearby schools including Lincoln Center Elementary, South St. Paul Secondary, and Academic Arts High School.
Ownership History
Date
Name
Owned For
Owner Type
Purchase Details
Closed on
Nov 13, 2015
Sold by
Anderson Matthew and Srock Anderson Amanda
Bought by
Warn Kristy
Current Estimated Value
Home Financials for this Owner
Home Financials are based on the most recent Mortgage that was taken out on this home.
Original Mortgage
$218,572
Outstanding Balance
$168,699
Interest Rate
3.25%
Mortgage Type
FHA
Estimated Equity
$196,010
Purchase Details
Closed on
Jul 24, 2009
Sold by
Ross Kevin and Ross Brian
Bought by
Anderson Matthew and Srock Amanda
Home Financials for this Owner
Home Financials are based on the most recent Mortgage that was taken out on this home.
Original Mortgage
$201,250
Interest Rate
5.43%
Mortgage Type
FHA
Purchase Details
Closed on
May 31, 2002
Sold by
Vandestreek Victoria A
Bought by
Ross Kevin and Ross Brian
Purchase Details
Closed on
May 19, 1999
Sold by
Bentson Troy Grant
Bought by
Vandestreek David L and Vandestreek Victoria A
Create a Home Valuation Report for This Property
The Home Valuation Report is an in-depth analysis detailing your home's value as well as a comparison with similar homes in the area
Home Values in the Area
Average Home Value in this Area
Purchase History
| Date | Buyer | Sale Price | Title Company |
|---|---|---|---|
| Warn Kristy | $226,500 | Watermark Title Agency | |
| Anderson Matthew | $205,000 | -- | |
| Ross Kevin | $192,000 | -- | |
| Vandestreek David L | $140,000 | -- |
Source: Public Records
Mortgage History
| Date | Status | Borrower | Loan Amount |
|---|---|---|---|
| Open | Warn Kristy | $218,572 | |
| Previous Owner | Anderson Matthew | $201,250 |
Source: Public Records
Tax History Compared to Growth
Tax History
| Year | Tax Paid | Tax Assessment Tax Assessment Total Assessment is a certain percentage of the fair market value that is determined by local assessors to be the total taxable value of land and additions on the property. | Land | Improvement |
|---|---|---|---|---|
| 2024 | $5,912 | $329,500 | $71,600 | $257,900 |
| 2023 | $5,912 | $334,900 | $72,100 | $262,800 |
| 2022 | $4,718 | $323,500 | $72,000 | $251,500 |
| 2021 | $4,346 | $286,100 | $62,600 | $223,500 |
| 2020 | $3,494 | $259,100 | $59,600 | $199,500 |
| 2019 | $3,350 | $264,000 | $56,800 | $207,200 |
| 2018 | $3,136 | $229,800 | $51,600 | $178,200 |
| 2017 | $3,008 | $221,800 | $49,200 | $172,600 |
| 2016 | $2,804 | $201,800 | $44,700 | $157,100 |
| 2015 | $2,627 | $178,035 | $38,401 | $139,634 |
| 2014 | -- | $176,836 | $38,356 | $138,480 |
| 2013 | -- | $147,842 | $32,651 | $115,191 |
Source: Public Records
Map
Nearby Homes
- 425 16th Ave N
- 436 17th Ave N
- 522 16th Ave N
- 1200 Dwane St
- 352 12th Ave N
- 606 13th Ave N
- 916 4th St N
- 212 11th Ave N
- 518 8th Ave N
- 2205 Acorn Ln
- 101 11th Ave N
- 119 10th Ave N
- 127 16th Ave S
- 114 20th Ave N
- 116 11th Ave S
- 818 16th Ave N
- 601 Levander Way Unit 101
- 601 Levander Way Unit 208
- 144 10th Ave S
- 921 17th Ave N
- 434 434 15th Ave N
- 434 15th Ave N
- 440 15th Ave N
- 440 440 15th Ave N
- 444 15th Ave N
- 444 444 15th-Avenue-n
- 429 429 15th-Avenue-n
- 437 437 15th-Avenue-n
- 448 15th Ave N
- 420 15th Ave N
- 435 14th Ave N
- 450 15th Ave N
- 443 14th Ave N
- 429 14th Ave N
- 435 15th Ave N
- 433 15th Ave N
- 437 15th Ave N
- 447 14th Ave N
- 429 15th Ave N
- 441 15th Ave N