434 Chestnut Ave Manteca, CA 95336
Downtown Manteca NeighborhoodEstimated Value: $385,000 - $456,000
About This Home
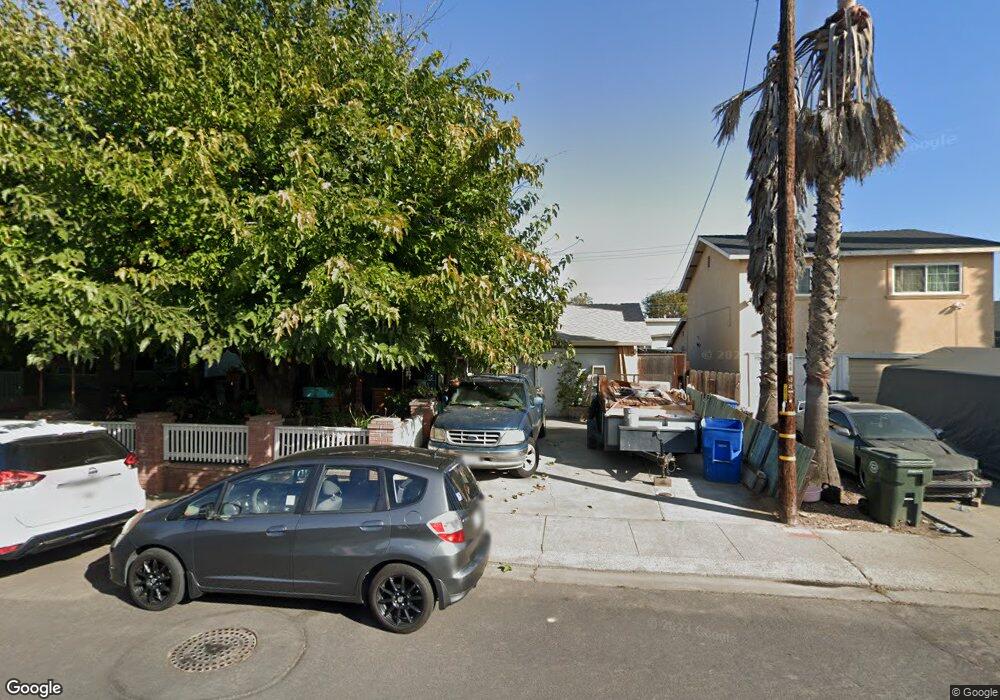
This home is located at 434 Chestnut Ave, Manteca, CA 95336 and is currently estimated at $412,279, approximately $334 per square foot. 434 Chestnut Ave is a home located in San Joaquin County with nearby schools including Lincoln Elementary School, Manteca High School, and St. Anthony's Catholic School.
Ownership History
We collect this data history from publicly available records. To have your information removed, we recommend requesting removal directly through your county’s website.
Purchase Details
Home Values in the Area
Average Home Value in this Area
Purchase History
We collect this data history from publicly available records. To have your information removed, we recommend requesting removal directly through your county’s website.
| Date | Buyer | Sale Price | Title Company |
|---|---|---|---|
| $107,000 | Chicago Title Co |
Mortgage History
We collect this data history from publicly available records. To have your information removed, we recommend requesting removal directly through your county’s website.
| Date | Status | Borrower | Loan Amount |
|---|---|---|---|
| Open | $20,610 |
Tax History
We collect this data history from publicly available records. To have your information removed, we recommend requesting removal directly through your county’s website.
| Year | Tax Paid | Tax Assessment Tax Assessment Total Assessment is a certain percentage of the fair market value that is determined by local assessors to be the total taxable value of land and additions on the property. | Land | Improvement |
|---|---|---|---|---|
| 2025 | $1,879 | $167,730 | $54,863 | $112,867 |
| 2024 | $1,826 | $164,442 | $53,788 | $110,654 |
| 2023 | $1,804 | $161,219 | $52,734 | $108,485 |
| 2022 | $1,777 | $158,058 | $51,700 | $106,358 |
| 2021 | $1,758 | $154,960 | $50,687 | $104,273 |
| 2020 | $1,687 | $153,372 | $50,168 | $103,204 |
| 2019 | $1,665 | $150,366 | $49,185 | $101,181 |
| 2018 | $1,643 | $147,419 | $48,221 | $99,198 |
| 2017 | $1,619 | $144,529 | $47,276 | $97,253 |
| 2016 | $1,580 | $141,696 | $46,349 | $95,347 |
| 2014 | $1,471 | $136,834 | $44,759 | $92,075 |
Map
- 526 Eleni Ln
- 322 Poplar Ave
- 228 Elm Ave
- 224 N Maple Ave
- 674 Privet Place
- 419 Pioneer Ave
- 445 N Walnut Ave
- 401 Amador Cir
- 544 Lode St
- 455 N Lincoln Ave
- 115 Willow Ave
- 414 Cherry Ln Unit G
- 136 Jessie Ave
- 403 Stockton St
- 821 Nevada St
- 657 Gold St
- 119 N Sherman Ave
- 1073 Hacienda Ave
- 846 Del Monte Ct
- 480 Cherry Ln Unit C
- 433 Chestnut Ave
- 429 Chestnut Ave
- 437 Chestnut Ave
- 434 Elm Ave
- 425 Chestnut Ave
- 441 Chestnut Ave
- 430 Elm Ave
- 438 Elm Ave
- 426 Elm Ave
- 442 Elm Ave
- 421 Chestnut Ave
- 445 Chestnut Ave
- 438 Chestnut Ave
- 430 Chestnut Ave
- 422 Elm Ave
- 442 Chestnut Ave
- 446 Elm Ave
- 426 Chestnut Ave
- 417 Chestnut Ave
- 446 Chestnut Ave
Ask me questions while you tour the home.