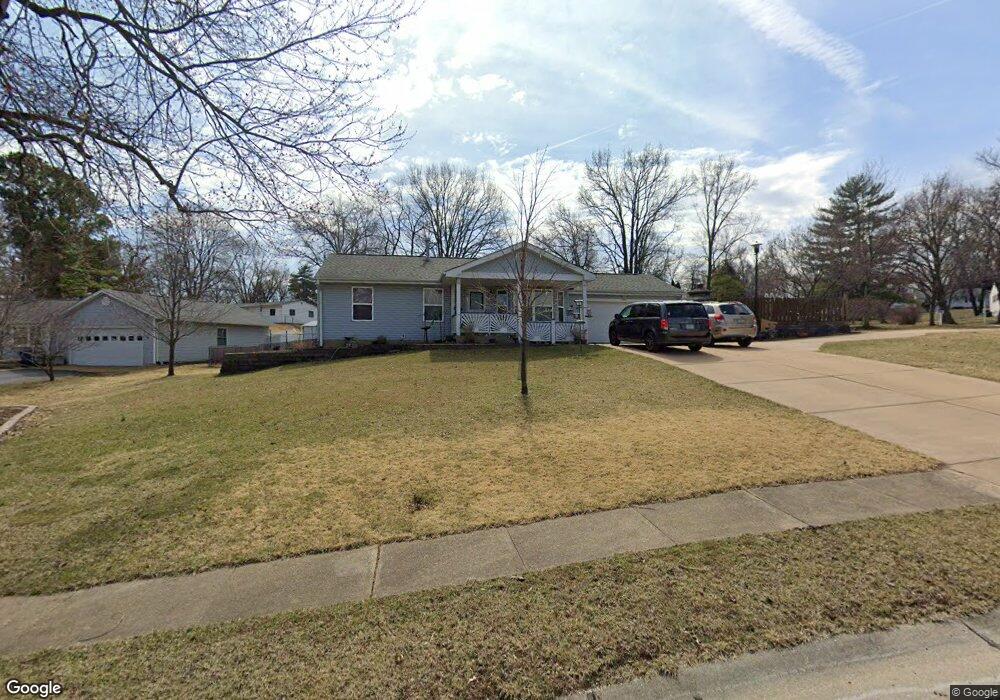
434 Covert Ct Ballwin, MO 63021
Estimated Value: $244,000 - $291,000
3
Beds
1
Bath
946
Sq Ft
$278/Sq Ft
Est. Value
About This Home
This home is located at 434 Covert Ct, Ballwin, MO 63021 and is currently estimated at $262,911, approximately $277 per square foot. 434 Covert Ct is a home located in St. Louis County with nearby schools including Ballwin Elementary School, Selvidge Middle School, and Marquette Sr. High School.
Ownership History
Date
Name
Owned For
Owner Type
Purchase Details
Closed on
Dec 10, 1997
Sold by
Backues Danny L and Backues Lisa L
Bought by
Backues Danny L and Markham Lisa L
Current Estimated Value
Home Financials for this Owner
Home Financials are based on the most recent Mortgage that was taken out on this home.
Original Mortgage
$26,100
Interest Rate
7.22%
Create a Home Valuation Report for This Property
The Home Valuation Report is an in-depth analysis detailing your home's value as well as a comparison with similar homes in the area
Home Values in the Area
Average Home Value in this Area
Purchase History
| Date | Buyer | Sale Price | Title Company |
|---|---|---|---|
| Backues Danny L | -- | -- |
Source: Public Records
Mortgage History
| Date | Status | Borrower | Loan Amount |
|---|---|---|---|
| Closed | Backues Danny L | $26,100 |
Source: Public Records
Tax History
| Year | Tax Paid | Tax Assessment Tax Assessment Total Assessment is a certain percentage of the fair market value that is determined by local assessors to be the total taxable value of land and additions on the property. | Land | Improvement |
|---|---|---|---|---|
| 2025 | $2,871 | $42,920 | $25,230 | $17,690 |
| 2024 | $2,871 | $40,890 | $21,030 | $19,860 |
| 2023 | $2,871 | $40,890 | $21,030 | $19,860 |
| 2022 | $2,604 | $34,430 | $21,030 | $13,400 |
| 2021 | $2,585 | $34,430 | $21,030 | $13,400 |
| 2020 | $2,385 | $30,260 | $17,780 | $12,480 |
| 2019 | $2,394 | $30,260 | $17,780 | $12,480 |
| 2018 | $2,099 | $24,980 | $13,980 | $11,000 |
| 2017 | $2,050 | $24,980 | $13,980 | $11,000 |
| 2016 | $1,864 | $21,810 | $9,920 | $11,890 |
| 2015 | $1,826 | $21,810 | $9,920 | $11,890 |
| 2014 | $1,747 | $20,330 | $7,430 | $12,900 |
Source: Public Records
Map
Nearby Homes
- 247 Ramsey Ln
- 275 Essen Ct Unit TBB
- 332 Remington Way Dr
- 429 Fairview Ct
- 112 Shirley Ln
- 533 Golfwood Dr
- 634 Parker Dr
- 318 Statewood Dr
- 521 Kehrs Mill Rd
- 548 Windsor Mill Dr
- 212 Lakeside Dr
- 947 Bellestri Dr
- 107 Falmouth Dr
- 756 Alexander Mark Way
- 3 Chappel Ct
- 313 Saint Lawrence Dr
- 127 Ivy Ct
- 53 Log Hill Ln
- 279 Aspen Village Dr
- 713 Village Wood Ct
Your Personal Tour Guide
Ask me questions while you tour the home.