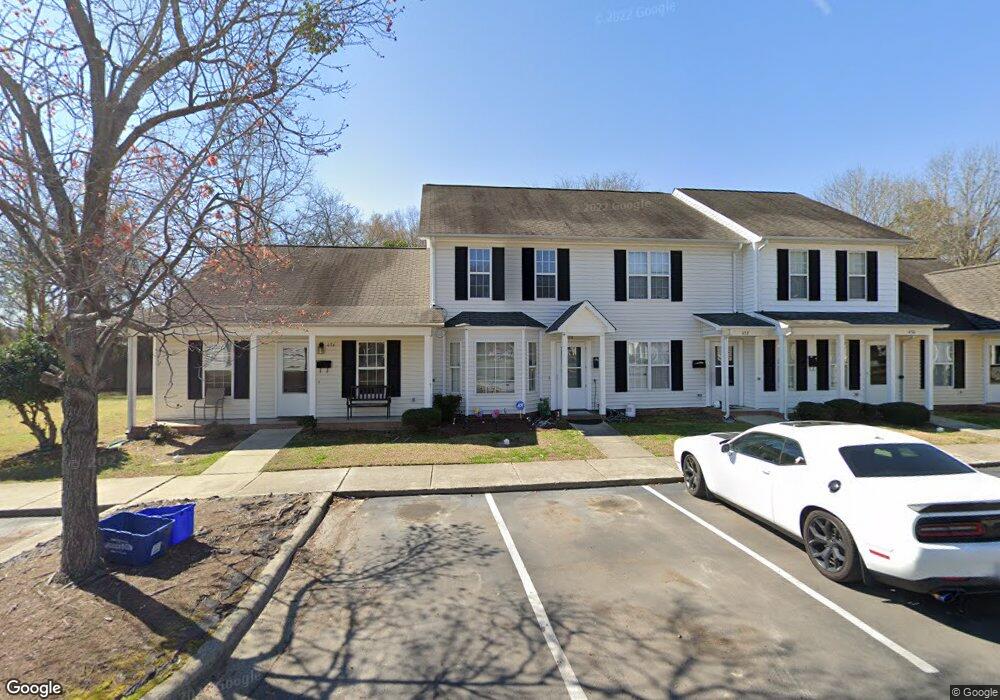
434 E Rose St Smithfield, NC 27577
Estimated Value: $140,000 - $182,000
2
Beds
3
Baths
1,066
Sq Ft
$159/Sq Ft
Est. Value
About This Home
This home is located at 434 E Rose St, Smithfield, NC 27577 and is currently estimated at $169,323, approximately $158 per square foot. 434 E Rose St is a home located in Johnston County with nearby schools including South Smithfield Elementary School, Smithfield Middle School, and Smithfield-Selma High School.
Ownership History
Date
Name
Owned For
Owner Type
Purchase Details
Closed on
May 31, 2007
Sold by
Stancil Ralph Warren and Stancil Amber Sellers
Bought by
Nguyen Vu V and Nguyen Trang T
Current Estimated Value
Home Financials for this Owner
Home Financials are based on the most recent Mortgage that was taken out on this home.
Original Mortgage
$81,500
Outstanding Balance
$49,680
Interest Rate
6.12%
Mortgage Type
Purchase Money Mortgage
Estimated Equity
$119,643
Create a Home Valuation Report for This Property
The Home Valuation Report is an in-depth analysis detailing your home's value as well as a comparison with similar homes in the area
Home Values in the Area
Average Home Value in this Area
Purchase History
| Date | Buyer | Sale Price | Title Company |
|---|---|---|---|
| Nguyen Vu V | $79,000 | None Available |
Source: Public Records
Mortgage History
| Date | Status | Borrower | Loan Amount |
|---|---|---|---|
| Open | Nguyen Vu V | $81,500 |
Source: Public Records
Tax History
| Year | Tax Paid | Tax Assessment Tax Assessment Total Assessment is a certain percentage of the fair market value that is determined by local assessors to be the total taxable value of land and additions on the property. | Land | Improvement |
|---|---|---|---|---|
| 2025 | $1,618 | $162,540 | $35,000 | $127,540 |
| 2024 | $1,122 | $86,280 | $22,500 | $63,780 |
| 2023 | $1,141 | $86,280 | $22,500 | $63,780 |
| 2022 | $1,177 | $86,280 | $22,500 | $63,780 |
| 2021 | $1,177 | $86,280 | $22,500 | $63,780 |
| 2020 | $1,204 | $86,280 | $22,500 | $63,780 |
| 2019 | $1,211 | $86,280 | $22,500 | $63,780 |
| 2018 | $1,264 | $88,790 | $28,000 | $60,790 |
| 2017 | $1,261 | $88,790 | $28,000 | $60,790 |
| 2016 | $1,280 | $88,790 | $28,000 | $60,790 |
| 2015 | $1,297 | $88,790 | $28,000 | $60,790 |
| 2014 | $1,269 | $88,790 | $28,000 | $60,790 |
Source: Public Records
Map
Nearby Homes
Your Personal Tour Guide
Ask me questions while you tour the home.