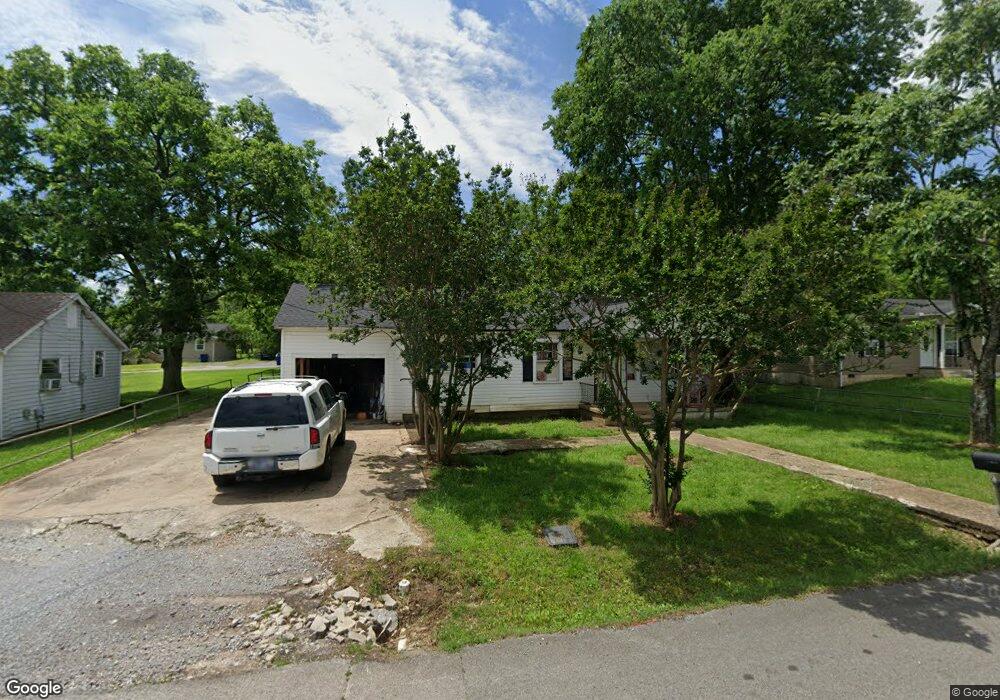
434 Fairground Heights Shelbyville, TN 37160
Estimated Value: $112,525 - $219,000
--
Bed
1
Bath
936
Sq Ft
$186/Sq Ft
Est. Value
About This Home
This home is located at 434 Fairground Heights, Shelbyville, TN 37160 and is currently estimated at $173,631, approximately $185 per square foot. 434 Fairground Heights is a home located in Bedford County with nearby schools including East Side Elementary School, Harris Middle School, and Christian Chapel Academy.
Ownership History
Date
Name
Owned For
Owner Type
Purchase Details
Closed on
Oct 19, 1996
Sold by
Raulerson Alan
Bought by
Womack Ada F and Womack Timothy
Current Estimated Value
Home Financials for this Owner
Home Financials are based on the most recent Mortgage that was taken out on this home.
Original Mortgage
$21,000
Interest Rate
8.15%
Purchase Details
Closed on
Feb 21, 1995
Bought by
Wharton Charles E
Purchase Details
Closed on
Feb 6, 1988
Bought by
Stephens Roy G and Mary Lou Reese
Purchase Details
Closed on
Oct 13, 1987
Bought by
Wharton F M
Purchase Details
Closed on
May 21, 1973
Bought by
Dye Margie Ruth
Create a Home Valuation Report for This Property
The Home Valuation Report is an in-depth analysis detailing your home's value as well as a comparison with similar homes in the area
Home Values in the Area
Average Home Value in this Area
Purchase History
| Date | Buyer | Sale Price | Title Company |
|---|---|---|---|
| Womack Ada F | $29,500 | -- | |
| Wharton Charles E | $32,000 | -- | |
| Stephens Roy G | $29,000 | -- | |
| Wharton F M | -- | -- | |
| Dye Margie Ruth | -- | -- |
Source: Public Records
Mortgage History
| Date | Status | Borrower | Loan Amount |
|---|---|---|---|
| Closed | Dye Margie Ruth | $21,000 |
Source: Public Records
Tax History Compared to Growth
Tax History
| Year | Tax Paid | Tax Assessment Tax Assessment Total Assessment is a certain percentage of the fair market value that is determined by local assessors to be the total taxable value of land and additions on the property. | Land | Improvement |
|---|---|---|---|---|
| 2025 | -- | $16,975 | $0 | $0 |
| 2024 | -- | $16,975 | $2,850 | $14,125 |
| 2023 | $646 | $16,975 | $2,850 | $14,125 |
| 2022 | $665 | $16,975 | $2,850 | $14,125 |
| 2021 | $604 | $16,975 | $2,850 | $14,125 |
| 2020 | $355 | $16,975 | $2,850 | $14,125 |
| 2019 | $355 | $8,000 | $2,500 | $5,500 |
| 2018 | $347 | $8,000 | $2,500 | $5,500 |
| 2017 | $347 | $8,000 | $2,500 | $5,500 |
| 2016 | $344 | $8,000 | $2,500 | $5,500 |
| 2015 | $343 | $8,000 | $2,500 | $5,500 |
| 2014 | $326 | $8,326 | $0 | $0 |
Source: Public Records
Map
Nearby Homes
- 107 Rockwood Dr
- 314 Maplewood Dr
- 207 Martha St
- 112 Elizabeth St
- 211 S Fairoak St
- 631 E Lane St
- 627 E Lane St
- 1024 Tennessee 64
- 464 Whitthorne St
- 215 Coney Island Rd
- 102 Germantown Rd
- 709 Belmont Ave
- 714 King Ave
- 713 King Ave
- 0 E Depot St
- 220 Walnut St
- 724 Alton Ave
- 117 Blue Ribbon Pkwy
- 527 Deery St
- 636 Deery St
- 436 Fairground Heights
- 430 Fairground Heights
- 438 Fairground Heights
- 115 Rockwood Dr
- 117 Rockwood Dr
- 428 Fairground Heights
- 431 Fairground Heights
- 433 Fairground Heights
- 440 Fairground Heights
- 429 Fairground Heights
- 113 Rockwood Dr
- 119 Rockwood Dr
- 427 Fairground Heights
- 111 Rockwood Dr
- 426 Fairground Heights
- 327 Maplewood Dr
- 329 Maplewood Dr
- 123 Rockwood Dr
- 331 Maplewood Dr
- 109 Rockwood Dr