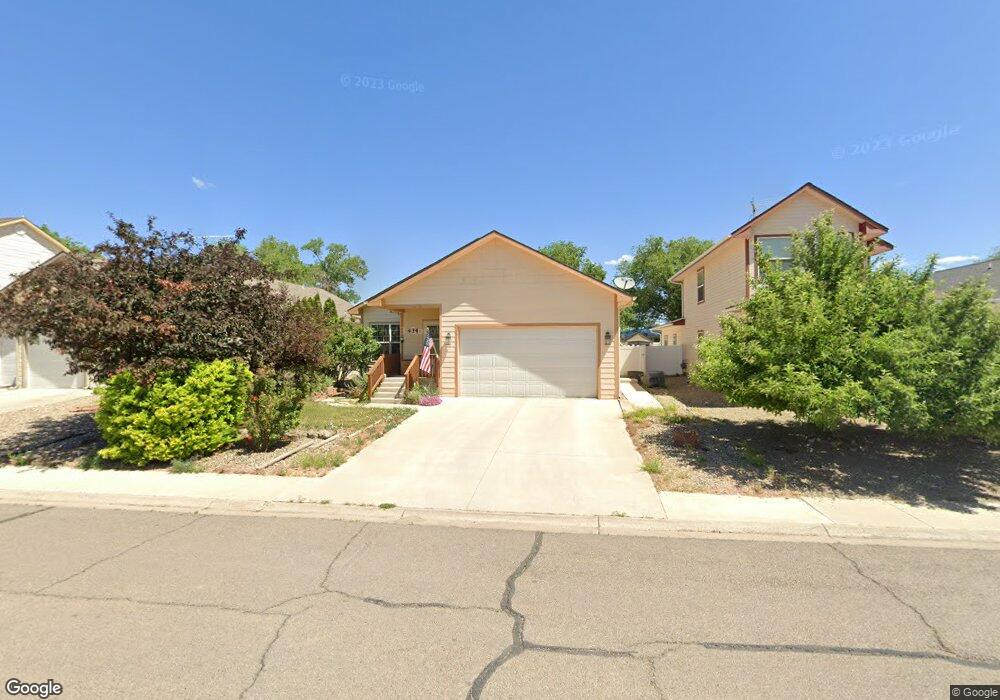
434 Juniper Place Cortez, CO 81321
Estimated Value: $343,322 - $371,000
3
Beds
2
Baths
2,129
Sq Ft
$168/Sq Ft
Est. Value
About This Home
This home is located at 434 Juniper Place, Cortez, CO 81321 and is currently estimated at $357,081, approximately $167 per square foot. 434 Juniper Place is a home located in Montezuma County with nearby schools including Montezuma-Cortez High School, Children's Kiva Montessori School, and Children's Kiva Montessori Preschool & Kindergarten.
Ownership History
Date
Name
Owned For
Owner Type
Purchase Details
Closed on
Oct 17, 2022
Sold by
Anderson Janet S
Bought by
Paul D Anderson And Janet S Anderson Trust
Current Estimated Value
Purchase Details
Closed on
Jul 31, 2017
Sold by
Warner Dusty Dean
Bought by
Mcdaniel Paul Anderson
Home Financials for this Owner
Home Financials are based on the most recent Mortgage that was taken out on this home.
Original Mortgage
$158,000
Interest Rate
3.91%
Mortgage Type
VA
Purchase Details
Closed on
Feb 28, 2006
Sold by
Great New Homes Ii Llc
Bought by
Briscoe Logan Tyler and Briscoe Shanda Rae
Home Financials for this Owner
Home Financials are based on the most recent Mortgage that was taken out on this home.
Original Mortgage
$60,750
Interest Rate
6.05%
Mortgage Type
Stand Alone Second
Create a Home Valuation Report for This Property
The Home Valuation Report is an in-depth analysis detailing your home's value as well as a comparison with similar homes in the area
Home Values in the Area
Average Home Value in this Area
Purchase History
| Date | Buyer | Sale Price | Title Company |
|---|---|---|---|
| Paul D Anderson And Janet S Anderson Trust | -- | -- | |
| Mcdaniel Paul Anderson | $188,000 | None Available | |
| Briscoe Logan Tyler | $202,500 | None Available |
Source: Public Records
Mortgage History
| Date | Status | Borrower | Loan Amount |
|---|---|---|---|
| Previous Owner | Mcdaniel Paul Anderson | $158,000 | |
| Previous Owner | Briscoe Logan Tyler | $60,750 |
Source: Public Records
Tax History Compared to Growth
Tax History
| Year | Tax Paid | Tax Assessment Tax Assessment Total Assessment is a certain percentage of the fair market value that is determined by local assessors to be the total taxable value of land and additions on the property. | Land | Improvement |
|---|---|---|---|---|
| 2024 | $964 | $18,743 | $2,068 | $16,675 |
| 2023 | $964 | $23,121 | $2,551 | $20,570 |
| 2022 | $905 | $18,707 | $2,551 | $16,156 |
| 2021 | $920 | $18,707 | $2,551 | $16,156 |
| 2020 | $706 | $14,917 | $2,551 | $12,366 |
| 2019 | $708 | $14,917 | $2,551 | $12,366 |
| 2018 | $870 | $13,650 | $2,310 | $11,340 |
| 2017 | $866 | $13,650 | $2,310 | $11,340 |
| 2016 | $877 | $15,260 | $2,550 | $12,710 |
| 2015 | $805 | $222,270 | $0 | $0 |
| 2014 | $937 | $15,260 | $0 | $0 |
Source: Public Records
Map
Nearby Homes
- 511 Juniper Place
- 506 Jarrett Ave
- 526 Juniper Place
- 410 W 6th St Unit 1
- 530 Juniper Place
- TBD Jarrett Ave
- TBD Chisholm Pl & Jarrett Ave
- 417 S Oak St
- 608 Alameda Dr
- 420 W 4th St
- 1005 S Cedar St
- 821 S Chestnut St
- TBD S Chestnut St
- 16 W 10th St
- 8 W 10th St
- 770 Stratton Dr
- 313 S Broadway
- 500 S Market St
- 777 Stratton Dr
- 519 S Beech St
- 430 Juniper Place
- 426 Juniper Place
- 506 Juniper Place
- 510 Juniper Place
- 435 Juniper Place
- 433 W 7th St
- 431 Juniper Place
- 503 Juniper Place
- 427 Juniper Place
- 421 W 7th St
- 423 Juniper Place
- 514 Juniper Place
- 418 Juniper Place
- 507 Juniper Place
- W 7th St Unit 521 W. Seventh St.
- W 7th St Unit 709 S. Market
- W 7th St Unit 82
- W 7th St
- 419 Juniper Place
- 402 Juniper Place