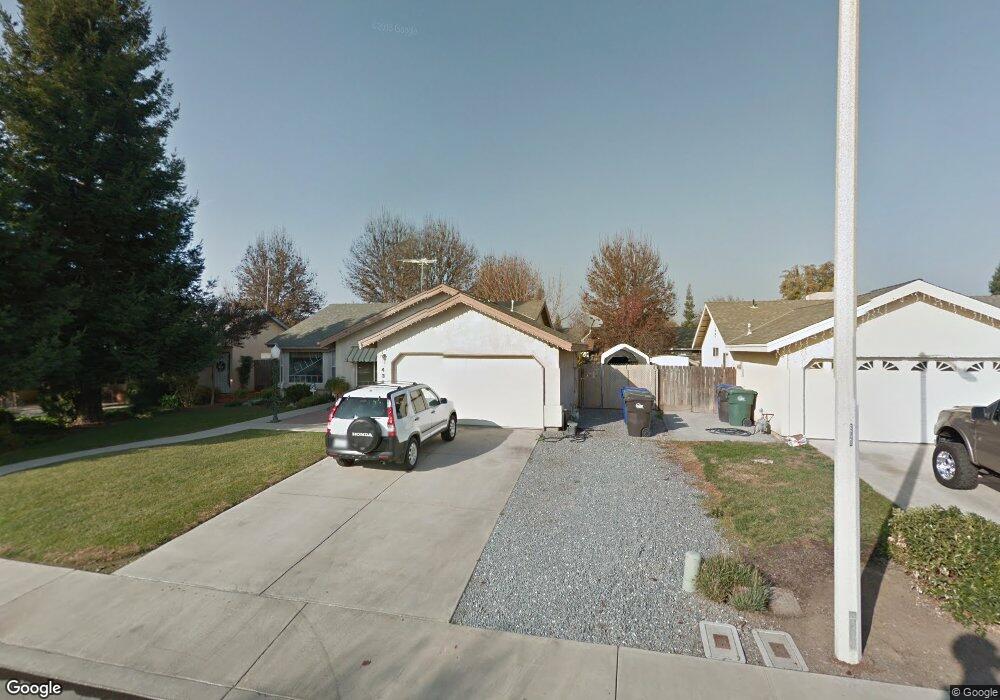
434 Kirsten St Farmersville, CA 93223
Estimated Value: $305,000 - $336,000
3
Beds
2
Baths
1,285
Sq Ft
$249/Sq Ft
Est. Value
About This Home
This home is located at 434 Kirsten St, Farmersville, CA 93223 and is currently estimated at $319,867, approximately $248 per square foot. 434 Kirsten St is a home located in Tulare County with nearby schools including Freedom Elementary School, J.E. Hester Elementary School, and George L. Snowden Elementary School.
Ownership History
Date
Name
Owned For
Owner Type
Purchase Details
Closed on
May 30, 2017
Sold by
Mcnabb John D
Bought by
Montano Jose Luis Aguilar and Deaguilar Luz Maria
Current Estimated Value
Home Financials for this Owner
Home Financials are based on the most recent Mortgage that was taken out on this home.
Original Mortgage
$181,649
Outstanding Balance
$152,520
Interest Rate
4.37%
Mortgage Type
FHA
Estimated Equity
$167,347
Purchase Details
Closed on
Apr 18, 2013
Sold by
Mcnabb John D and Mcnabb Dee Ann E
Bought by
Mcnabb John D and Mcnabb Dee Ann E
Purchase Details
Closed on
Nov 24, 1998
Sold by
Castlewood Partners Inc
Bought by
Mcnabb John D and Mcnabb Dee Ann E
Home Financials for this Owner
Home Financials are based on the most recent Mortgage that was taken out on this home.
Original Mortgage
$100,150
Interest Rate
6.66%
Mortgage Type
FHA
Create a Home Valuation Report for This Property
The Home Valuation Report is an in-depth analysis detailing your home's value as well as a comparison with similar homes in the area
Home Values in the Area
Average Home Value in this Area
Purchase History
| Date | Buyer | Sale Price | Title Company |
|---|---|---|---|
| Montano Jose Luis Aguilar | $185,000 | Stewart Title Company | |
| Mcnabb John D | -- | None Available | |
| Mcnabb John D | $100,500 | Fidelity National Title Co |
Source: Public Records
Mortgage History
| Date | Status | Borrower | Loan Amount |
|---|---|---|---|
| Open | Montano Jose Luis Aguilar | $181,649 | |
| Previous Owner | Mcnabb John D | $100,150 |
Source: Public Records
Tax History Compared to Growth
Tax History
| Year | Tax Paid | Tax Assessment Tax Assessment Total Assessment is a certain percentage of the fair market value that is determined by local assessors to be the total taxable value of land and additions on the property. | Land | Improvement |
|---|---|---|---|---|
| 2025 | $2,461 | $214,705 | $52,225 | $162,480 |
| 2024 | $2,461 | $210,496 | $51,201 | $159,295 |
| 2023 | $2,470 | $206,370 | $50,198 | $156,172 |
| 2022 | $2,295 | $202,324 | $49,214 | $153,110 |
| 2021 | $2,256 | $198,357 | $48,249 | $150,108 |
| 2020 | $2,243 | $196,323 | $47,754 | $148,569 |
| 2019 | $2,258 | $192,474 | $46,818 | $145,656 |
| 2018 | $2,207 | $188,700 | $45,900 | $142,800 |
| 2017 | $1,572 | $135,493 | $33,772 | $101,721 |
| 2016 | $1,492 | $132,836 | $33,110 | $99,726 |
| 2015 | $1,258 | $130,841 | $32,613 | $98,228 |
| 2014 | $1,258 | $113,000 | $28,000 | $85,000 |
Source: Public Records
Map
Nearby Homes
- 391 Teddy St
- 0 Avenue 288
- 1643 Tehama Ave
- 0 Apn 128-030-056-000 Unit 218742
- 0 Avenue 288
- 322 E Citrus Dr
- 0 S Farmersville Blvd Unit 238390
- 896 Farmersville Rd
- 701 Farmersville Rd
- 896 N Mariposa Ave
- 438 N Magnolia Ave
- 371 N Farmersville Blvd
- 732 N Dwight Ave
- 903 E Ash St
- 885 E Ash St
- 753 N Brundage Ave
- 680 E Larry St
- 738 E Larry St
- 209 S Magnolia Ave
- 327 S Farmersville Blvd
- 434 W Kristen St
- 412 Kirsten St
- 450 Kirsten St
- 433 Greg St
- 392 W Kristen St
- 392 Kirsten St
- 449 Greg St
- 411 Greg St
- 464 Kirsten St
- 464 W Kristen St
- 413 W Kristen St
- 435 Kirsten St
- 391 Greg St
- 467 Greg St
- 413 Kirsten St Unit 3
- 451 Kirsten St
- 378 W Kristen St
- 378 Kirsten St
- 393 Kirsten St
- 465 Kirsten St