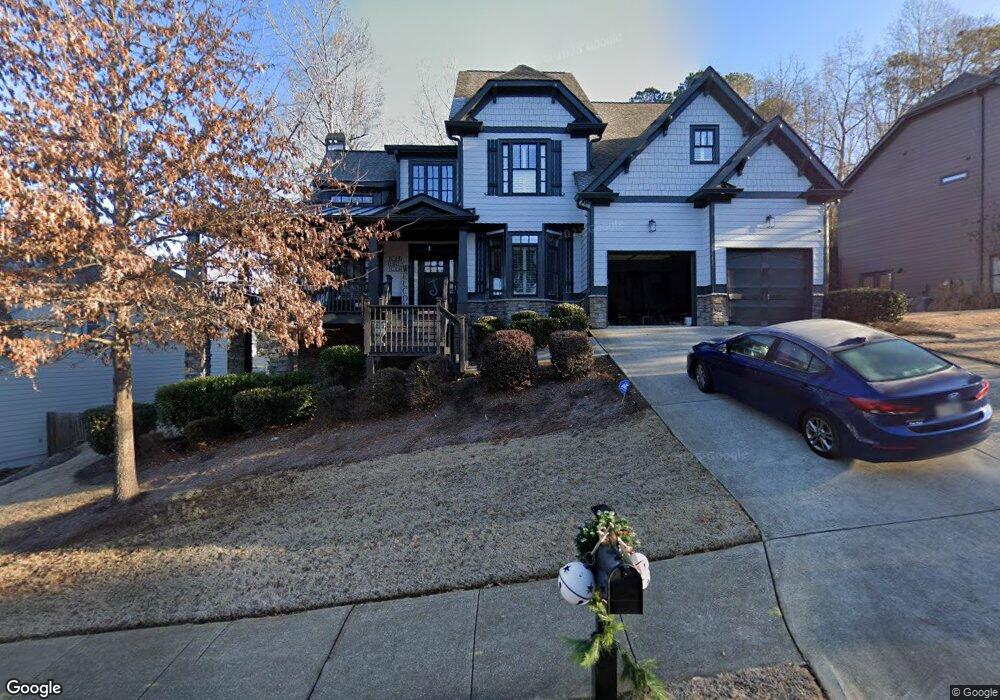
434 Pine Bluff Dr Unit 1 Dallas, GA 30157
Cedarcrest NeighborhoodEstimated Value: $489,000 - $546,590
5
Beds
5
Baths
2,474
Sq Ft
$212/Sq Ft
Est. Value
About This Home
This home is located at 434 Pine Bluff Dr Unit 1, Dallas, GA 30157 and is currently estimated at $525,648, approximately $212 per square foot. 434 Pine Bluff Dr Unit 1 is a home located in Paulding County with nearby schools including Roland W. Russom Elementary School, East Paulding Middle School, and North Paulding High School.
Ownership History
Date
Name
Owned For
Owner Type
Purchase Details
Closed on
May 11, 2023
Sold by
Williams Toyanda
Bought by
434 Pine Bluff Drive Llc
Current Estimated Value
Purchase Details
Closed on
Sep 20, 2021
Sold by
Bolton Richard Brian
Bought by
Williams Toyanda and Williams Emoni
Home Financials for this Owner
Home Financials are based on the most recent Mortgage that was taken out on this home.
Original Mortgage
$352,000
Interest Rate
2.8%
Mortgage Type
New Conventional
Purchase Details
Closed on
May 6, 2016
Sold by
Ivester Jerry C
Bought by
Bolton Richard Brian
Home Financials for this Owner
Home Financials are based on the most recent Mortgage that was taken out on this home.
Original Mortgage
$311,258
Interest Rate
3.5%
Mortgage Type
FHA
Create a Home Valuation Report for This Property
The Home Valuation Report is an in-depth analysis detailing your home's value as well as a comparison with similar homes in the area
Home Values in the Area
Average Home Value in this Area
Purchase History
| Date | Buyer | Sale Price | Title Company |
|---|---|---|---|
| 434 Pine Bluff Drive Llc | $580,000 | -- | |
| Williams Toyanda | $440,000 | -- | |
| Bolton Richard Brian | $317,000 | -- |
Source: Public Records
Mortgage History
| Date | Status | Borrower | Loan Amount |
|---|---|---|---|
| Previous Owner | Williams Toyanda | $352,000 | |
| Previous Owner | Bolton Richard Brian | $311,258 |
Source: Public Records
Tax History Compared to Growth
Tax History
| Year | Tax Paid | Tax Assessment Tax Assessment Total Assessment is a certain percentage of the fair market value that is determined by local assessors to be the total taxable value of land and additions on the property. | Land | Improvement |
|---|---|---|---|---|
| 2024 | $4,833 | $194,308 | $26,000 | $168,308 |
| 2023 | $4,782 | $183,436 | $26,000 | $157,436 |
| 2022 | $4,295 | $164,752 | $26,000 | $138,752 |
| 2021 | $3,956 | $137,984 | $26,000 | $111,984 |
| 2020 | $3,962 | $135,252 | $26,000 | $109,252 |
| 2019 | $3,916 | $131,836 | $26,000 | $105,836 |
| 2018 | $3,724 | $125,480 | $26,000 | $99,480 |
| 2017 | $3,572 | $118,800 | $26,000 | $92,800 |
| 2016 | $2,923 | $98,520 | $26,000 | $72,520 |
| 2015 | $2,838 | $94,080 | $27,600 | $66,480 |
| 2014 | $2,831 | $91,560 | $27,600 | $63,960 |
| 2013 | -- | $72,720 | $27,600 | $45,120 |
Source: Public Records
Map
Nearby Homes
- 454 Pine Bluff Dr
- 36 Evergreen Way
- 20 Evergreen Way
- 11 Blue Spruce Trail
- 73 White Spruce Trail
- 334 Maple View Ct
- 00 Hiram Acworth Hwy
- 200 Pine Trail
- 75 Pine Creek Ct
- The Adams Plan at Timberlands Station
- 66 Pine Creek Ct Unit 73
- 58 Pine Trail
- 288 Pine Way
- 320 Mill Creek Hollow
- 612 Homestead Dr
- 373 Homestead Dr
- 21 Mill Creek Hollow
- 84 Mill Creek Hollow
- 45 Homestead Dr
- 33 Mill Creek Hollow
- 434 Pine Bluff Dr
- 412 Pine Bluff Dr
- 470 Pine Bluff Dr
- 392 Pine Bluff Dr
- 34 Wood Point Ct
- 372 Pine Bluff Dr
- 439 Pine Bluff Dr
- 451 Pine Bluff Dr
- 425 Pine Bluff Dr
- 467 Pine Bluff Dr
- 39 Evergreen Way
- 50 Wood Point Ct
- 415 Pine Bluff Dr Unit 1
- 0 Wood Point Ct Unit 7486589
- 0 Wood Point Ct Unit 7331108
- 0 Wood Point Ct
- 25 Wood Point Ct
- 25 Wood Point Ct Unit 1
- 403 Pine Bluff Dr
- 51 Evergreen Way