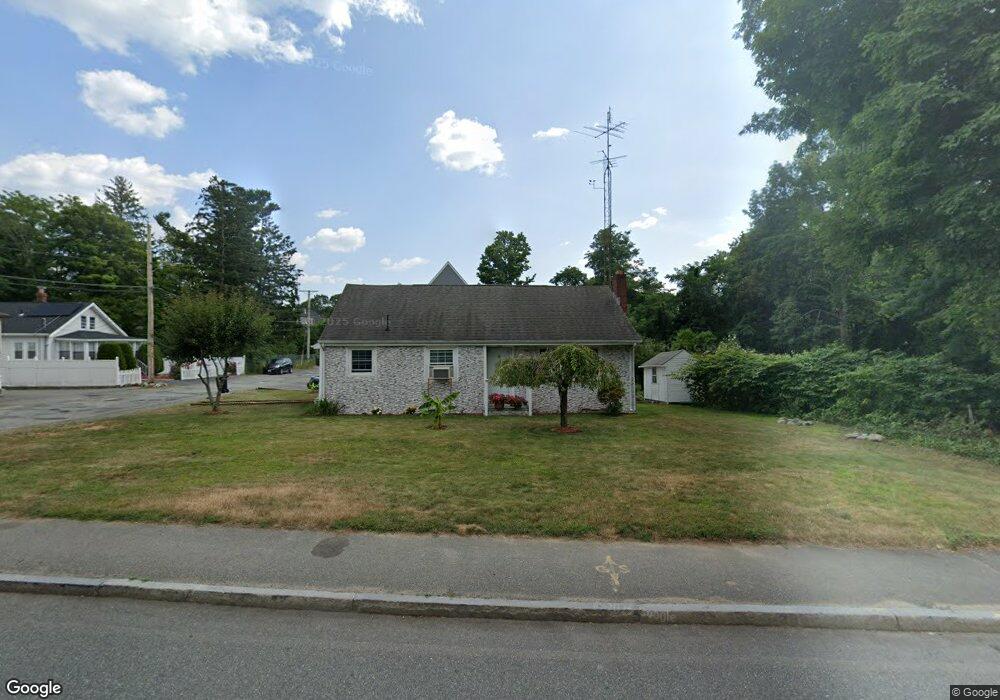
434 Prospect St Brockton, MA 02301
Estimated Value: $466,000 - $503,745
3
Beds
2
Baths
1,412
Sq Ft
$344/Sq Ft
Est. Value
About This Home
This home is located at 434 Prospect St, Brockton, MA 02301 and is currently estimated at $486,186, approximately $344 per square foot. 434 Prospect St is a home located in Plymouth County with nearby schools including Louis F Angelo Elementary School, Raymond K-8 Elementary School, and Hancock Elementary School.
Ownership History
Date
Name
Owned For
Owner Type
Purchase Details
Closed on
Jan 14, 1997
Sold by
Hays Jeffrey J and Hays Susan J
Bought by
Seemeuang Soy
Current Estimated Value
Home Financials for this Owner
Home Financials are based on the most recent Mortgage that was taken out on this home.
Original Mortgage
$89,150
Outstanding Balance
$9,429
Interest Rate
7.46%
Mortgage Type
Purchase Money Mortgage
Estimated Equity
$476,757
Create a Home Valuation Report for This Property
The Home Valuation Report is an in-depth analysis detailing your home's value as well as a comparison with similar homes in the area
Home Values in the Area
Average Home Value in this Area
Purchase History
| Date | Buyer | Sale Price | Title Company |
|---|---|---|---|
| Seemeuang Soy | $89,000 | -- |
Source: Public Records
Mortgage History
| Date | Status | Borrower | Loan Amount |
|---|---|---|---|
| Open | Seemeuang Soy | $89,150 |
Source: Public Records
Tax History Compared to Growth
Tax History
| Year | Tax Paid | Tax Assessment Tax Assessment Total Assessment is a certain percentage of the fair market value that is determined by local assessors to be the total taxable value of land and additions on the property. | Land | Improvement |
|---|---|---|---|---|
| 2025 | $5,097 | $420,900 | $140,200 | $280,700 |
| 2024 | $5,053 | $420,400 | $140,200 | $280,200 |
| 2023 | $4,986 | $384,100 | $104,700 | $279,400 |
| 2022 | $4,447 | $318,300 | $95,200 | $223,100 |
| 2021 | $4,314 | $297,500 | $79,200 | $218,300 |
| 2020 | $4,418 | $291,600 | $74,100 | $217,500 |
| 2019 | $4,250 | $273,500 | $72,200 | $201,300 |
| 2018 | $3,301 | $248,600 | $72,200 | $176,400 |
| 2017 | $3,301 | $205,000 | $72,200 | $132,800 |
| 2016 | $3,378 | $194,600 | $70,000 | $124,600 |
| 2015 | $3,009 | $165,800 | $70,000 | $95,800 |
| 2014 | $3,320 | $183,100 | $70,000 | $113,100 |
Source: Public Records
Map
Nearby Homes
- 20 Montauk Rd
- 77 Colonel Bell Dr Unit 4
- 75 Colonel Bell Dr Unit 77-11
- 4 Park Rd
- 68 Cross St
- 45 Cross St
- 7 N Winnifred Rd
- 161 Moraine St
- 72 W Elm Terrace
- 194 Prospect St
- 721 Pleasant St
- 126 Coventry Cir
- 96 Coventry Cir
- 34 Eaton St
- 10 Fitzpatrick Ave
- 0 Moraine St
- 15 Troy St
- 32 Milton St
- 72 Kurland Ave
- 137 Boylston St
- 14 Fields Ave
- 424 Prospect St
- 17 Fields Ave
- 437 Prospect St
- 451 Prospect St
- 420 Prospect St
- 416 Prospect St
- 479 Pleasant St
- 417 Prospect St
- 507 Pleasant St
- 408 Prospect St
- 467 Pleasant St
- 447 Prospect St
- 411 Prospect St
- 463 Pleasant St
- 12 Colonel Bell Dr
- 459 Prospect St
- 405 Prospect St
- 476 Pleasant St
- 476 Pleasant St