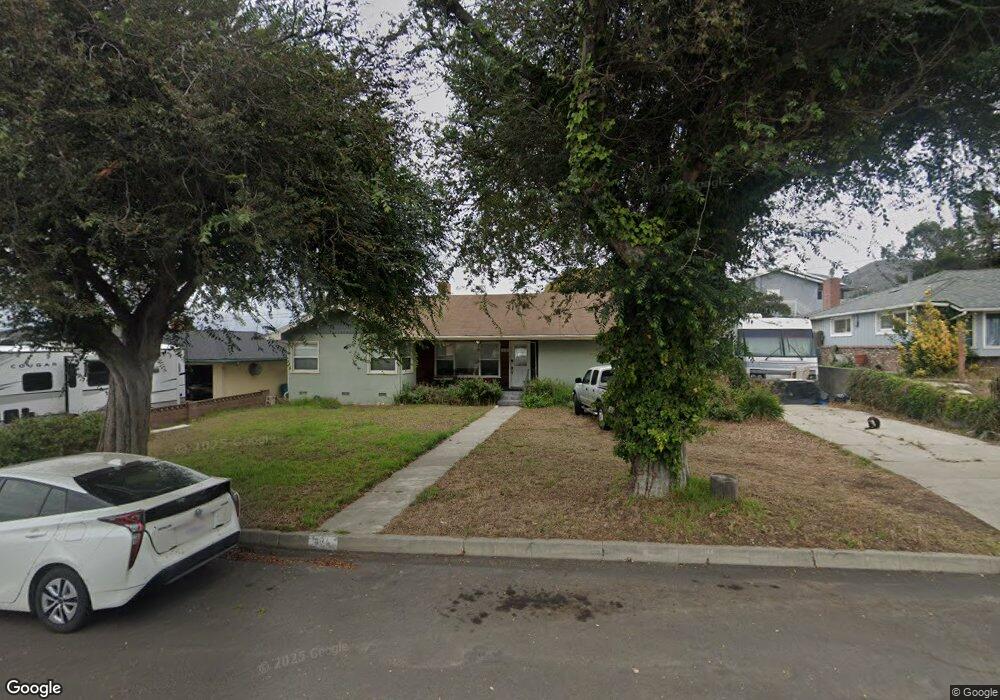
434 S E St Lompoc, CA 93436
Estimated Value: $587,365 - $645,000
3
Beds
2
Baths
1,778
Sq Ft
$349/Sq Ft
Est. Value
About This Home
This home is located at 434 S E St, Lompoc, CA 93436 and is currently estimated at $621,341, approximately $349 per square foot. 434 S E St is a home located in Santa Barbara County with nearby schools including Arthur Hapgood Elementary School, Lompoc Valley Middle School, and Lompoc High School.
Ownership History
Date
Name
Owned For
Owner Type
Purchase Details
Closed on
Nov 30, 2012
Sold by
Flaherty Graham O and Flaherty Gretchen L
Bought by
Digirolamo Adina
Current Estimated Value
Home Financials for this Owner
Home Financials are based on the most recent Mortgage that was taken out on this home.
Original Mortgage
$198,000
Outstanding Balance
$137,052
Interest Rate
3.35%
Mortgage Type
New Conventional
Estimated Equity
$484,289
Purchase Details
Closed on
Feb 21, 2007
Sold by
Wagner Sue
Bought by
Flaherty Graham Q and Flaherty Gretshen L
Home Financials for this Owner
Home Financials are based on the most recent Mortgage that was taken out on this home.
Original Mortgage
$347,200
Interest Rate
6%
Mortgage Type
Purchase Money Mortgage
Purchase Details
Closed on
Mar 25, 2005
Sold by
Wagner Eric
Bought by
Wagner Sue
Home Financials for this Owner
Home Financials are based on the most recent Mortgage that was taken out on this home.
Original Mortgage
$340,750
Interest Rate
1.25%
Mortgage Type
Purchase Money Mortgage
Purchase Details
Closed on
Jan 3, 1996
Sold by
Price Dana T and Price Janet L
Bought by
Wagner Eric and Wagner Sue
Home Financials for this Owner
Home Financials are based on the most recent Mortgage that was taken out on this home.
Original Mortgage
$145,350
Interest Rate
7.18%
Create a Home Valuation Report for This Property
The Home Valuation Report is an in-depth analysis detailing your home's value as well as a comparison with similar homes in the area
Home Values in the Area
Average Home Value in this Area
Purchase History
| Date | Buyer | Sale Price | Title Company |
|---|---|---|---|
| Digirolamo Adina | $220,000 | Fidelity National Title Co | |
| Flaherty Graham Q | $434,000 | Chicago Title Company | |
| Wagner Sue | -- | Chicago Title Company | |
| Wagner Eric | $153,000 | First American Title |
Source: Public Records
Mortgage History
| Date | Status | Borrower | Loan Amount |
|---|---|---|---|
| Open | Digirolamo Adina | $198,000 | |
| Previous Owner | Flaherty Graham Q | $347,200 | |
| Previous Owner | Wagner Sue | $340,750 | |
| Previous Owner | Wagner Eric | $145,350 |
Source: Public Records
Tax History
| Year | Tax Paid | Tax Assessment Tax Assessment Total Assessment is a certain percentage of the fair market value that is determined by local assessors to be the total taxable value of land and additions on the property. | Land | Improvement |
|---|---|---|---|---|
| 2025 | $2,895 | $270,900 | $86,193 | $184,707 |
| 2023 | $2,895 | $260,383 | $82,847 | $177,536 |
| 2022 | $2,841 | $255,278 | $81,223 | $174,055 |
| 2021 | $2,870 | $250,274 | $79,631 | $170,643 |
| 2020 | $2,839 | $247,709 | $78,815 | $168,894 |
| 2019 | $2,791 | $242,853 | $77,270 | $165,583 |
| 2018 | $2,746 | $238,092 | $75,755 | $162,337 |
| 2017 | $2,694 | $233,424 | $74,270 | $159,154 |
| 2016 | $2,644 | $228,848 | $72,814 | $156,034 |
| 2014 | $2,585 | $220,998 | $70,317 | $150,681 |
Source: Public Records
Map
Nearby Homes
Your Personal Tour Guide
Ask me questions while you tour the home.