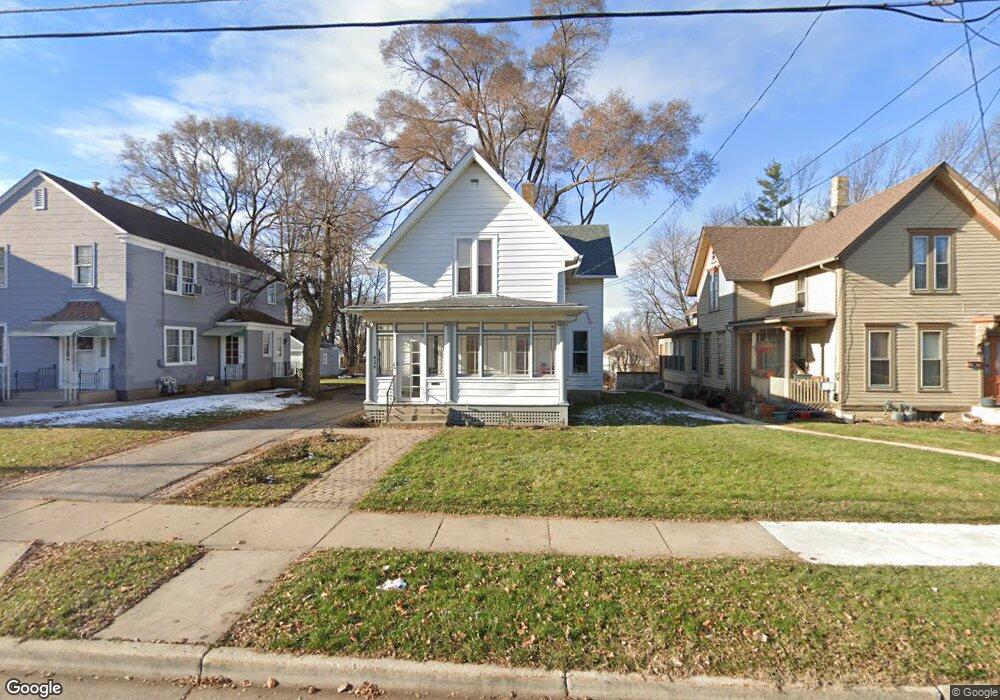
434 St Charles St Elgin, IL 60120
Elgin National Watch Historic District NeighborhoodEstimated Value: $267,000 - $355,000
3
Beds
2
Baths
2,200
Sq Ft
$140/Sq Ft
Est. Value
About This Home
This home is located at 434 St Charles St, Elgin, IL 60120 and is currently estimated at $308,707, approximately $140 per square foot. 434 St Charles St is a home located in Kane County with nearby schools including Garfield Elementary School, Kenyon Woods Middle School, and South Elgin High School.
Ownership History
Date
Name
Owned For
Owner Type
Purchase Details
Closed on
May 11, 2023
Sold by
Orellana Jose O
Bought by
Sedano Gabriela G Tinajero
Current Estimated Value
Purchase Details
Closed on
Oct 12, 2017
Sold by
Jarvis Robert
Bought by
Orellana Jose O
Purchase Details
Closed on
Nov 17, 2008
Sold by
Wells Fargo Bank Na
Bought by
Jarvis Robert C
Purchase Details
Closed on
Sep 26, 2008
Sold by
Delgado Juan Efren and Delgado Ana Maria J
Bought by
Wells Fargo Bank Na
Purchase Details
Closed on
Dec 28, 1994
Sold by
Villanueva Benjamin and Villanueva Diana
Bought by
Delgado Juan Efren and Delgado Ana Maria J
Home Financials for this Owner
Home Financials are based on the most recent Mortgage that was taken out on this home.
Original Mortgage
$106,033
Interest Rate
9.23%
Mortgage Type
FHA
Create a Home Valuation Report for This Property
The Home Valuation Report is an in-depth analysis detailing your home's value as well as a comparison with similar homes in the area
Home Values in the Area
Average Home Value in this Area
Purchase History
| Date | Buyer | Sale Price | Title Company |
|---|---|---|---|
| Sedano Gabriela G Tinajero | -- | None Listed On Document | |
| Orellana Jose O | $125,000 | Chicago Title | |
| Jarvis Robert C | $75,000 | Attorneys Title Guaranty Fun | |
| Wells Fargo Bank Na | -- | None Available | |
| Delgado Juan Efren | $107,000 | Chicago Title Insurance Co |
Source: Public Records
Mortgage History
| Date | Status | Borrower | Loan Amount |
|---|---|---|---|
| Previous Owner | Delgado Juan Efren | $106,033 |
Source: Public Records
Tax History Compared to Growth
Tax History
| Year | Tax Paid | Tax Assessment Tax Assessment Total Assessment is a certain percentage of the fair market value that is determined by local assessors to be the total taxable value of land and additions on the property. | Land | Improvement |
|---|---|---|---|---|
| 2024 | $7,659 | $95,704 | $15,001 | $80,703 |
| 2023 | $6,688 | $86,461 | $13,552 | $72,909 |
| 2022 | $6,316 | $78,837 | $12,357 | $66,480 |
| 2021 | $6,041 | $73,707 | $11,553 | $62,154 |
| 2020 | $5,613 | $67,539 | $11,029 | $56,510 |
| 2019 | $5,448 | $64,335 | $10,506 | $53,829 |
| 2018 | $4,648 | $52,996 | $9,897 | $43,099 |
| 2017 | $5,153 | $50,100 | $9,356 | $40,744 |
| 2016 | $4,957 | $46,479 | $8,680 | $37,799 |
| 2015 | -- | $42,602 | $7,956 | $34,646 |
| 2014 | -- | $42,076 | $7,858 | $34,218 |
| 2013 | -- | $49,384 | $8,065 | $41,319 |
Source: Public Records
Map
Nearby Homes
- 364 Bent St
- 518 Raymond St
- 262 Bartlett Place
- 306 S Liberty St
- 603 Wellington Ave
- 628 S Liberty St
- 270 Villa St
- 277 Gifford Place
- 661 Wellington Ave
- 644 Lavoie Ave
- 645 Lavoie Ave
- 72 Harding St
- 422 Ryerson Ave
- 536 Aller Ave
- 528 E Chicago St
- 552 E Chicago St
- 527 Ashland Ave
- 331 Griswold St
- 309 Griswold St
- 539 Lucille Ave
- 434 Saint Charles St
- 428 Saint Charles St
- 436 Saint Charles St
- 426 Saint Charles St
- 444 Saint Charles St Unit 446
- 422 Saint Charles St
- 422 St Charles St
- 435 Saint Charles St
- 452 Saint Charles St Unit 452
- 437 Saint Charles St
- 431 Saint Charles St
- 379 Yarwood St
- 418 Saint Charles St
- 448 Saint Charles St Unit 452
- 383 Yarwood St
- 427 Saint Charles St
- 456 Regent St
- 377 Yarwood St
- 419 Saint Charles St
- 375 Yarwood St