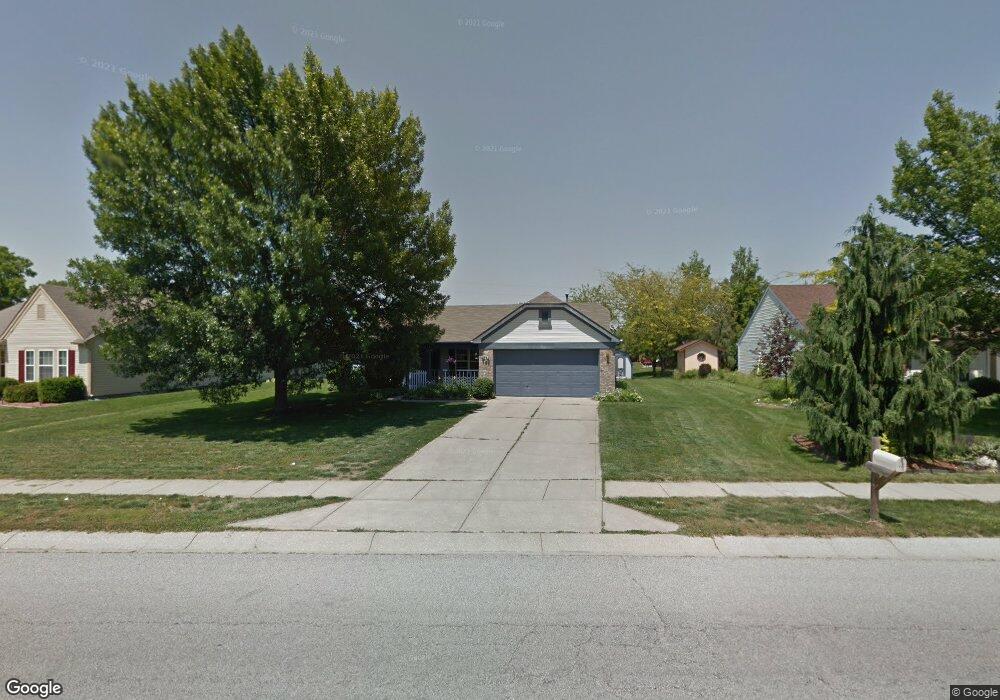
434 Sycamore St Brownsburg, IN 46112
Estimated Value: $270,621 - $291,000
3
Beds
2
Baths
1,310
Sq Ft
$213/Sq Ft
Est. Value
About This Home
This home is located at 434 Sycamore St, Brownsburg, IN 46112 and is currently estimated at $279,155, approximately $213 per square foot. 434 Sycamore St is a home located in Hendricks County with nearby schools including Eagle Elementary School, Brownsburg West Middle School, and Brownsburg High School.
Ownership History
Date
Name
Owned For
Owner Type
Purchase Details
Closed on
Jun 21, 2005
Sold by
Reinhardt Rodney R
Bought by
Pierle Edward L and Pierle Kimberly K
Current Estimated Value
Home Financials for this Owner
Home Financials are based on the most recent Mortgage that was taken out on this home.
Original Mortgage
$106,575
Outstanding Balance
$53,808
Interest Rate
5.75%
Mortgage Type
FHA
Estimated Equity
$225,347
Create a Home Valuation Report for This Property
The Home Valuation Report is an in-depth analysis detailing your home's value as well as a comparison with similar homes in the area
Home Values in the Area
Average Home Value in this Area
Purchase History
| Date | Buyer | Sale Price | Title Company |
|---|---|---|---|
| Pierle Edward L | -- | None Available | |
| Reinhardt Rodney R | -- | None Available |
Source: Public Records
Mortgage History
| Date | Status | Borrower | Loan Amount |
|---|---|---|---|
| Open | Pierle Edward L | $106,575 |
Source: Public Records
Tax History
| Year | Tax Paid | Tax Assessment Tax Assessment Total Assessment is a certain percentage of the fair market value that is determined by local assessors to be the total taxable value of land and additions on the property. | Land | Improvement |
|---|---|---|---|---|
| 2025 | $2,413 | $238,600 | $39,000 | $199,600 |
| 2024 | $2,413 | $241,300 | $39,000 | $202,300 |
| 2023 | $2,319 | $229,600 | $37,100 | $192,500 |
| 2022 | $1,884 | $189,700 | $36,700 | $153,000 |
| 2021 | $1,644 | $163,200 | $34,000 | $129,200 |
| 2020 | $1,561 | $154,900 | $34,000 | $120,900 |
| 2019 | $1,412 | $142,600 | $31,200 | $111,400 |
| 2018 | $1,419 | $139,400 | $31,200 | $108,200 |
| 2017 | $1,378 | $135,100 | $30,600 | $104,500 |
| 2016 | $1,332 | $130,500 | $30,600 | $99,900 |
| 2014 | $1,203 | $120,300 | $29,400 | $90,900 |
Source: Public Records
Map
Nearby Homes
- 390 Vinewood Dr N
- 4475 Yellowwood Ave
- 4472 Yellowwood Ave
- 4494 Yellowwood Ave
- 6274 Chelsea St
- 4498 Yellowwood Ave
- 4502 Yellowwood Ave
- 4481 Yellowwood Ave
- 7643 Sagamore Dr
- 4508 Yellowwood Ave
- 6284 Chelsea St
- 6278 Chelsea St
- 4507 Yellowwood Ave
- 212 Hamilton St
- 6 Kristelli Ct
- 1314 Holiday Ln E
- 1444 Sweet Gum Dr S
- 1313 S Odell St
- 529 Maple Ln
- 506 S Green St
- 422 Sycamore St
- 446 Sycamore St
- 375 Vinewood Dr S
- 381 Vinewood Dr S
- 369 Vinewood Dr S
- 410 Sycamore St
- 458 Sycamore St
- 1002 Randall Way
- 385 Vinewood Dr S
- 385 Vinewood Dr S Unit U24 B20
- 3 Daniel Cir
- 363 Vinewood Dr S
- 372 Sycamore St
- 470 Sycamore St
- 1024 Randall Way
- 391 Vinewood Dr S
- 391 Vinewood Dr S Unit 21
- 355 Vinewood Dr S
- 376 Vinewood Dr S
- 364 Vinewood Dr S
Your Personal Tour Guide
Ask me questions while you tour the home.