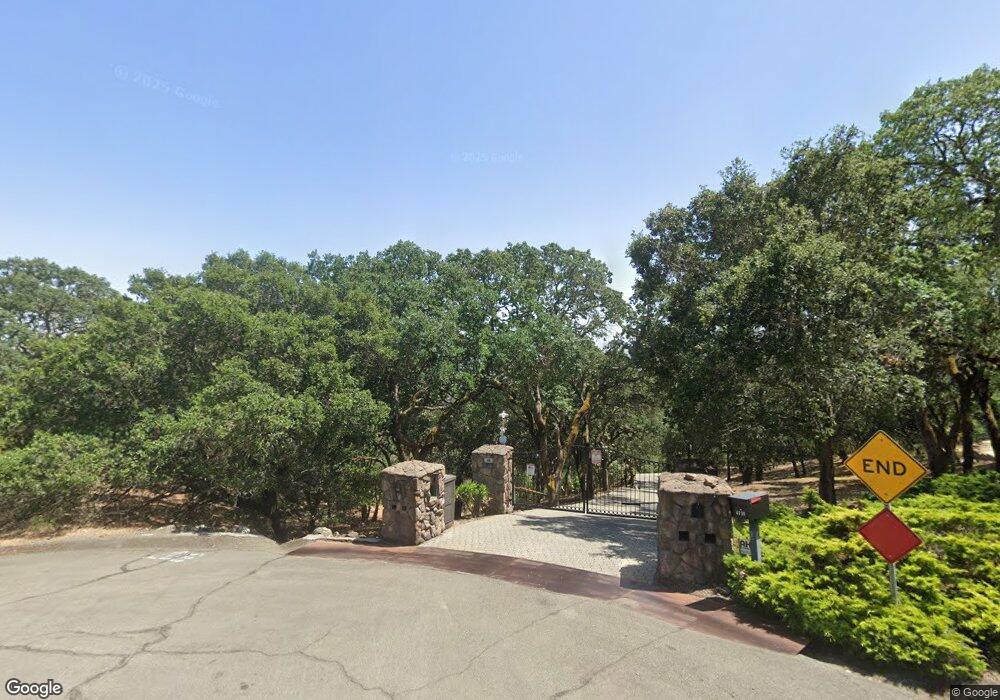
4340 Edinburg Ct Fairfield, CA 94534
Estimated Value: $2,069,416 - $3,160,000
4
Beds
4
Baths
4,869
Sq Ft
$511/Sq Ft
Est. Value
About This Home
This home is located at 4340 Edinburg Ct, Fairfield, CA 94534 and is currently estimated at $2,487,472, approximately $510 per square foot. 4340 Edinburg Ct is a home located in Solano County with nearby schools including Nelda Mundy Elementary School, Green Valley Middle School, and Angelo Rodriguez High School.
Ownership History
Date
Name
Owned For
Owner Type
Purchase Details
Closed on
Jun 9, 2025
Sold by
Choi Sooyoun
Bought by
Choi Mark K
Current Estimated Value
Home Financials for this Owner
Home Financials are based on the most recent Mortgage that was taken out on this home.
Original Mortgage
$1,560,000
Outstanding Balance
$1,555,956
Interest Rate
6.76%
Mortgage Type
New Conventional
Estimated Equity
$931,516
Purchase Details
Closed on
Feb 10, 1998
Sold by
Oh William Y and Oh Gail K
Bought by
Choi Mark K
Home Financials for this Owner
Home Financials are based on the most recent Mortgage that was taken out on this home.
Original Mortgage
$650,000
Interest Rate
6.9%
Mortgage Type
Purchase Money Mortgage
Purchase Details
Closed on
Dec 22, 1993
Sold by
Zitelli Courtney R
Bought by
Oh William Y and Oh Gail K
Home Financials for this Owner
Home Financials are based on the most recent Mortgage that was taken out on this home.
Original Mortgage
$375,000
Interest Rate
4.12%
Mortgage Type
Purchase Money Mortgage
Create a Home Valuation Report for This Property
The Home Valuation Report is an in-depth analysis detailing your home's value as well as a comparison with similar homes in the area
Home Values in the Area
Average Home Value in this Area
Purchase History
| Date | Buyer | Sale Price | Title Company |
|---|---|---|---|
| Choi Mark K | -- | Stewart Title Guaranty Company | |
| Choi Mark K | $850,000 | Placer Title Company | |
| Oh William Y | $930,000 | Frontier Title Company |
Source: Public Records
Mortgage History
| Date | Status | Borrower | Loan Amount |
|---|---|---|---|
| Open | Choi Mark K | $1,560,000 | |
| Previous Owner | Choi Mark K | $650,000 | |
| Previous Owner | Oh William Y | $375,000 | |
| Closed | Choi Mark K | $85,000 |
Source: Public Records
Tax History Compared to Growth
Tax History
| Year | Tax Paid | Tax Assessment Tax Assessment Total Assessment is a certain percentage of the fair market value that is determined by local assessors to be the total taxable value of land and additions on the property. | Land | Improvement |
|---|---|---|---|---|
| 2025 | $15,511 | $1,357,256 | $479,029 | $878,227 |
| 2024 | $15,511 | $1,330,644 | $469,637 | $861,007 |
| 2023 | $15,043 | $1,304,554 | $460,429 | $844,125 |
| 2022 | $14,856 | $1,278,975 | $451,401 | $827,574 |
| 2021 | $14,702 | $1,253,898 | $442,550 | $811,348 |
| 2020 | $14,357 | $1,241,042 | $438,013 | $803,029 |
| 2019 | $13,994 | $1,216,709 | $429,425 | $787,284 |
| 2018 | $14,406 | $1,192,853 | $421,005 | $771,848 |
| 2017 | $13,746 | $1,169,464 | $412,750 | $756,714 |
| 2016 | $13,666 | $1,146,534 | $404,657 | $741,877 |
| 2015 | $12,771 | $1,129,313 | $398,579 | $730,734 |
| 2014 | $12,648 | $1,107,192 | $390,772 | $716,420 |
Source: Public Records
Map
Nearby Homes
- 4320 Edinburg Ct
- 103 Brae Ct
- 1687 Rockville Rd
- 1424 Rockville Rd
- 0 Vac Sn Luis Potosi Vic Eljorna Unit HD25051665
- 4499 Green Valley Rd
- 4418 Green Valley Rd
- 1795 Green Valley Oaks Dr
- 1879 Rockville Rd
- 4144 Green Valley Rd
- 0 Green Valley Ln Unit Lot 5 325038523
- 0 Green Valley Ln Unit Lot 6 325038375
- 0 Green Valley Ln Unit Lot 3 325038524
- 1009 Cypressridge Place
- 955 Appleridge Place
- 5249 Deer Ridge Ct
- 744 Emerald Bay Dr
- 743 Bridle Ridge Ct
- 746 Bridle Ridge Ct
- 2129 Rockville Rd
- 109 Brae Ct
- 4376 Edinburg Ct Unit B
- 4376 Edinburg Ct
- 4363 Edinburg Ct
- 107 Brae Ct
- 110 Brae Ct
- 108 Brae Ct
- 4371 Edinburg Ct
- 105 Brae Ct
- 111 Brae Ct
- 4377 Edinburg Ct
- 4384 Edinburg Ct
- 106 Brae Ct
- 1582 Rockville Rd
- 1601 Amaral Ct
- 1574 Rockville Rd
- 1604 Amaral Ct
- 4398 Edinburg Ct
- 104 Brae Ct
- 1566 Rockville Rd