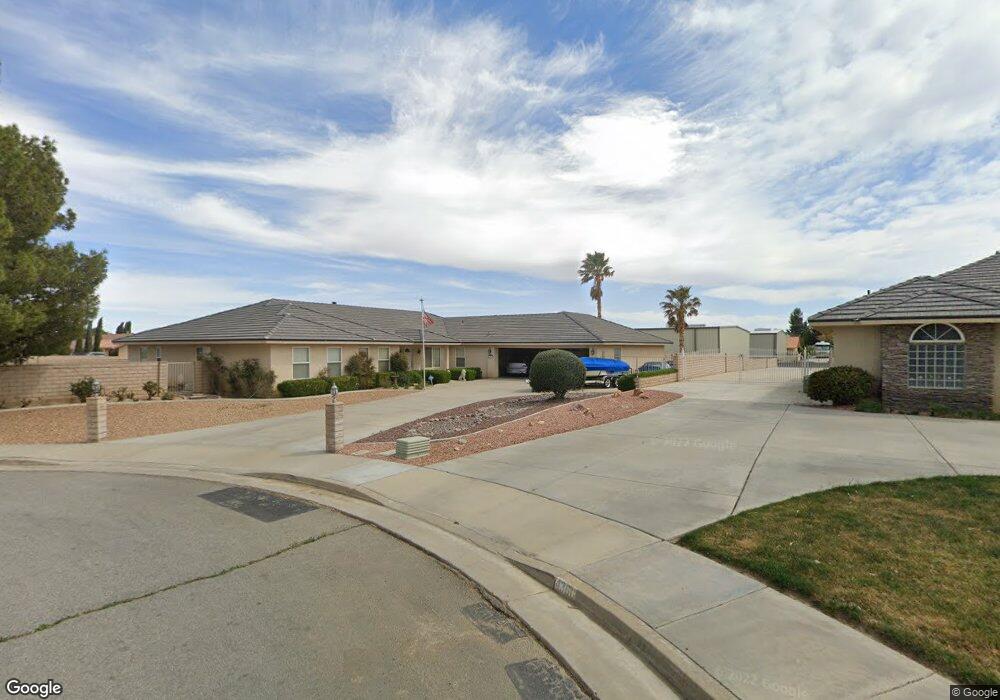
4340 Knox Ave Rosamond, CA 93560
Estimated Value: $561,000 - $771,000
4
Beds
3
Baths
2,847
Sq Ft
$218/Sq Ft
Est. Value
About This Home
This home is located at 4340 Knox Ave, Rosamond, CA 93560 and is currently estimated at $621,403, approximately $218 per square foot. 4340 Knox Ave is a home located in Kern County.
Ownership History
Date
Name
Owned For
Owner Type
Purchase Details
Closed on
May 20, 2024
Sold by
Roger Hensley And Melanie Hensley Living and Hensley Roger
Bought by
Hensley Roger
Current Estimated Value
Home Financials for this Owner
Home Financials are based on the most recent Mortgage that was taken out on this home.
Original Mortgage
$237,000
Outstanding Balance
$233,856
Interest Rate
7.17%
Mortgage Type
New Conventional
Estimated Equity
$387,547
Purchase Details
Closed on
Jun 3, 2003
Sold by
Hensley Roger and Hensley Melanie
Bought by
Hensley Roger and Hensley Melanie
Purchase Details
Closed on
Jan 15, 1997
Sold by
Skypark Llc
Bought by
Hensley Roger and Hensley Melanie
Home Financials for this Owner
Home Financials are based on the most recent Mortgage that was taken out on this home.
Original Mortgage
$4,057
Interest Rate
7.46%
Mortgage Type
Seller Take Back
Create a Home Valuation Report for This Property
The Home Valuation Report is an in-depth analysis detailing your home's value as well as a comparison with similar homes in the area
Home Values in the Area
Average Home Value in this Area
Purchase History
| Date | Buyer | Sale Price | Title Company |
|---|---|---|---|
| Hensley Roger | -- | Stewart Title Of California | |
| Hensley Roger | -- | Stewart Title Of California | |
| Hensley Roger | -- | First American Title Co | |
| Hensley Roger | $4,500 | -- |
Source: Public Records
Mortgage History
| Date | Status | Borrower | Loan Amount |
|---|---|---|---|
| Open | Hensley Roger | $237,000 | |
| Previous Owner | Hensley Roger | $4,057 |
Source: Public Records
Tax History Compared to Growth
Tax History
| Year | Tax Paid | Tax Assessment Tax Assessment Total Assessment is a certain percentage of the fair market value that is determined by local assessors to be the total taxable value of land and additions on the property. | Land | Improvement |
|---|---|---|---|---|
| 2025 | $6,167 | $402,719 | $56,868 | $345,851 |
| 2024 | $6,034 | $394,824 | $55,753 | $339,071 |
| 2023 | $6,034 | $387,083 | $54,660 | $332,423 |
| 2022 | $5,847 | $379,495 | $53,589 | $325,906 |
| 2021 | $5,673 | $372,056 | $52,539 | $319,517 |
| 2020 | $5,554 | $368,243 | $52,001 | $316,242 |
| 2019 | $4,659 | $368,243 | $52,001 | $316,242 |
| 2018 | $4,529 | $353,947 | $49,983 | $303,964 |
| 2017 | $4,453 | $347,008 | $49,003 | $298,005 |
| 2016 | $4,248 | $340,205 | $48,043 | $292,162 |
| 2015 | $4,303 | $335,096 | $47,322 | $287,774 |
| 2014 | $4,365 | $328,534 | $46,396 | $282,138 |
Source: Public Records
Map
Nearby Homes
- 4209 W Rosamond Blvd Unit 73
- 0 Stetson Ave Unit ND25224969
- 6081 Felsite Ave
- 4010 Stetson Ave
- 0 Felsite Unit 24005805
- 0 Felsite Unit CV25047192
- 0 Felsite Unit 24005806
- 0 Felsite Unit 530057
- 0 Felsite Unit 24005808
- 0 Felsite Unit 25005543
- 4500 W Rosamond Blvd Unit 21
- 0 Vic 45th St W and Truman Rd Unit 25007530
- 3823 45th St W
- 4800 W Rosamond Blvd
- 50 St. Rosamond Blvd
- 3300 156th St W
- 0 Knox Ave
- 3013 Via Bella Rosa Ave
- 4851 Truman Rd
- 0 Werner St
- 4360 Knox Ave
- 4300 Knox Ave
- 4380 Knox Ave
- 4341 Knox Ave
- 4280 Knox Ave
- 4400 Knox Ave
- 4371 Knox Ave
- 4301 Stetson Ave
- 4341 Stetson Ave
- 4321 Stetson Ave
- 4361 Stetson Ave
- 4381 Stetson Ave
- 4260 Knox Ave
- 4281 Stetson Ave
- 4401 Knox Ave
- 4420 Knox Ave
- 4401 Stetson Ave
- 4240 Knox Ave
- 4440 Knox Ave
- 4261 Stetson Ave