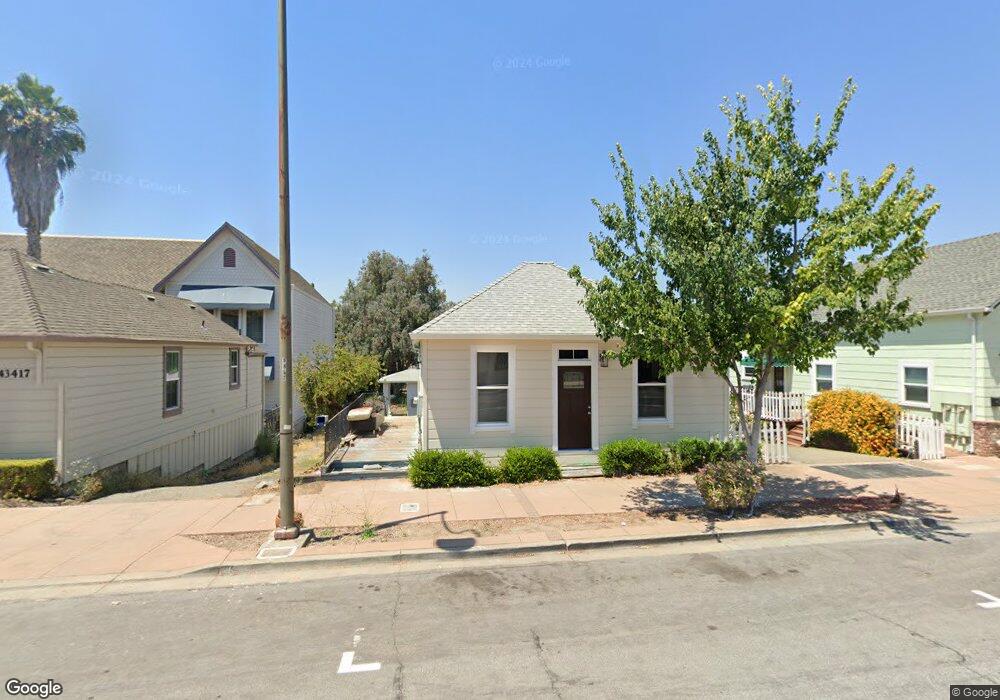
43409 Mission Blvd Fremont, CA 94539
Mission San Jose NeighborhoodEstimated Value: $1,602,129 - $1,773,000
3
Beds
1
Bath
1,248
Sq Ft
$1,350/Sq Ft
Est. Value
About This Home
This home is located at 43409 Mission Blvd, Fremont, CA 94539 and is currently estimated at $1,684,782, approximately $1,349 per square foot. 43409 Mission Blvd is a home located in Alameda County with nearby schools including Mission San Jose Elementary School, William Hopkins Junior High School, and Mission San Jose High School.
Ownership History
Date
Name
Owned For
Owner Type
Purchase Details
Closed on
Dec 11, 2017
Sold by
Fami Norris Anna Mae and Fami Anna Mae Norris Revocable
Bought by
Tianfang Properties Usa Llc
Current Estimated Value
Purchase Details
Closed on
May 12, 2009
Sold by
Norris Anna Mae and Anna Mae Norris Family Trust
Bought by
Fami Norris Anna Mae and Fami Anna Mae Norris Revocable
Home Financials for this Owner
Home Financials are based on the most recent Mortgage that was taken out on this home.
Original Mortgage
$938,250
Interest Rate
3.41%
Mortgage Type
Reverse Mortgage Home Equity Conversion Mortgage
Purchase Details
Closed on
Feb 8, 2001
Sold by
Norris Anna Mae
Bought by
Norris Anna Mae and Anna Mae Norris Family Trust
Create a Home Valuation Report for This Property
The Home Valuation Report is an in-depth analysis detailing your home's value as well as a comparison with similar homes in the area
Home Values in the Area
Average Home Value in this Area
Purchase History
| Date | Buyer | Sale Price | Title Company |
|---|---|---|---|
| Tianfang Properties Usa Llc | $895,000 | Chicago Title Company | |
| Fami Norris Anna Mae | -- | Old Republic Title Company | |
| Norris Anna Mae | -- | -- |
Source: Public Records
Mortgage History
| Date | Status | Borrower | Loan Amount |
|---|---|---|---|
| Previous Owner | Fami Norris Anna Mae | $938,250 |
Source: Public Records
Tax History Compared to Growth
Tax History
| Year | Tax Paid | Tax Assessment Tax Assessment Total Assessment is a certain percentage of the fair market value that is determined by local assessors to be the total taxable value of land and additions on the property. | Land | Improvement |
|---|---|---|---|---|
| 2025 | $13,293 | $1,143,739 | $568,905 | $574,834 |
| 2024 | $13,293 | $1,100,572 | $557,750 | $542,822 |
| 2023 | $11,816 | $978,798 | $546,815 | $431,983 |
| 2022 | $11,671 | $959,610 | $536,095 | $423,515 |
| 2021 | $11,384 | $940,797 | $525,585 | $415,212 |
| 2020 | $11,439 | $931,158 | $520,200 | $410,958 |
| 2019 | $11,308 | $912,900 | $510,000 | $402,900 |
| 2018 | $11,089 | $895,000 | $500,000 | $395,000 |
| 2017 | $4,512 | $343,173 | $274,540 | $68,633 |
| 2016 | $4,426 | $336,444 | $269,157 | $67,287 |
| 2015 | $4,358 | $331,391 | $265,114 | $66,277 |
| 2014 | $4,276 | $324,899 | $259,921 | $64,978 |
Source: Public Records
Map
Nearby Homes
- 43382 Bryant St
- 43547 Ellsworth St
- 341 Dana St
- 483 Becado Place
- 138 Telles Ln
- 463 Becado Place
- 42965 Corte Verde
- 42955 Corte Verde
- 335 Via Rosario
- 124 Linmore Dr
- 905 Glenhill Dr
- 42099 Vinha Way
- 646 Bella Vista Ct
- 600 Praderia Cir
- 41997 Via San Gabriel
- 379 Felipe Common
- 44423 View Point Cir
- 1873 Berry Ct
- 2164 Ocaso Camino
- 42329 Troyer Ave
- 43433 Mission Blvd
- 43417 Mission Blvd
- 43387 Mission Blvd
- 43414 Ellsworth St
- 43400 Ellsworth St
- 43426 Ellsworth St
- 43430 Mission Blvd
- 43480 Mission Blvd
- 43377 Mission Blvd
- 43432 Ellsworth St
- 43388 Ellsworth St
- 43372 Ellsworth St
- 43419 Mission Siena Cir
- 43411 Mission Siena Cir
- 43486 Ellsworth St
- 43427 Mission Siena Cir
- 43403 Mission Siena Cir
- 43360 Mission Blvd
- 43341 Mission Blvd
- 101 Mission Siena Terrace