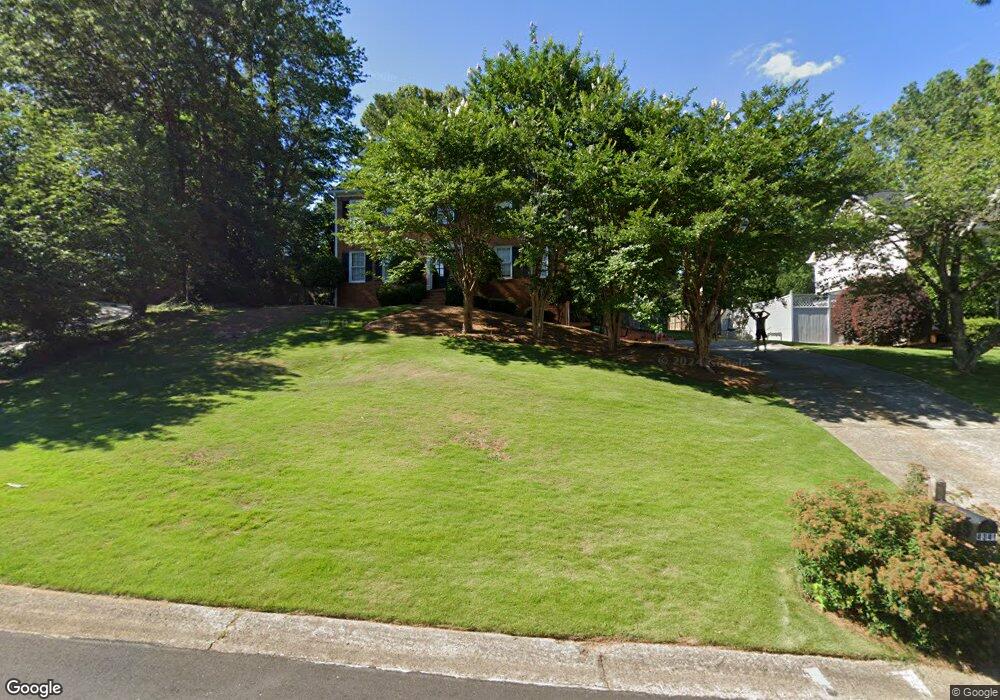
4341 Cornwallis Ct NE Unit B Marietta, GA 30068
Estimated Value: $730,000 - $887,000
4
Beds
4
Baths
3,289
Sq Ft
$242/Sq Ft
Est. Value
About This Home
This home is located at 4341 Cornwallis Ct NE Unit B, Marietta, GA 30068 and is currently estimated at $796,349, approximately $242 per square foot. 4341 Cornwallis Ct NE Unit B is a home located in Cobb County with nearby schools including Mount Bethel Elementary School, Dickerson Middle School, and Walton High School.
Ownership History
Date
Name
Owned For
Owner Type
Purchase Details
Closed on
Dec 28, 2010
Sold by
Segell Scott R and Segell Denise F
Bought by
Lasky Spencer M and Lasky Kate F
Current Estimated Value
Home Financials for this Owner
Home Financials are based on the most recent Mortgage that was taken out on this home.
Original Mortgage
$292,000
Outstanding Balance
$199,171
Interest Rate
4.79%
Mortgage Type
New Conventional
Estimated Equity
$597,178
Purchase Details
Closed on
Dec 12, 2002
Sold by
Hans Richard A and Hans Calista J
Bought by
Segell Scott R and Segell Denise F
Home Financials for this Owner
Home Financials are based on the most recent Mortgage that was taken out on this home.
Original Mortgage
$215,700
Interest Rate
6.1%
Mortgage Type
New Conventional
Purchase Details
Closed on
Jun 16, 1994
Sold by
Howard John F
Bought by
Hans Richard A Calista
Home Financials for this Owner
Home Financials are based on the most recent Mortgage that was taken out on this home.
Original Mortgage
$185,250
Interest Rate
8.73%
Create a Home Valuation Report for This Property
The Home Valuation Report is an in-depth analysis detailing your home's value as well as a comparison with similar homes in the area
Home Values in the Area
Average Home Value in this Area
Purchase History
| Date | Buyer | Sale Price | Title Company |
|---|---|---|---|
| Lasky Spencer M | $365,000 | -- | |
| Segell Scott R | $359,500 | -- | |
| Hans Richard A Calista | $195,000 | -- |
Source: Public Records
Mortgage History
| Date | Status | Borrower | Loan Amount |
|---|---|---|---|
| Open | Lasky Spencer M | $292,000 | |
| Previous Owner | Segell Scott R | $215,700 | |
| Previous Owner | Hans Richard A Calista | $185,250 |
Source: Public Records
Tax History Compared to Growth
Tax History
| Year | Tax Paid | Tax Assessment Tax Assessment Total Assessment is a certain percentage of the fair market value that is determined by local assessors to be the total taxable value of land and additions on the property. | Land | Improvement |
|---|---|---|---|---|
| 2024 | $5,855 | $226,724 | $60,000 | $166,724 |
| 2023 | $5,663 | $242,912 | $36,000 | $206,912 |
| 2022 | $5,696 | $217,504 | $36,000 | $181,504 |
| 2021 | $5,280 | $198,504 | $36,000 | $162,504 |
| 2020 | $5,280 | $198,504 | $36,000 | $162,504 |
| 2019 | $5,280 | $198,504 | $36,000 | $162,504 |
| 2018 | $5,280 | $198,504 | $36,000 | $162,504 |
| 2017 | $4,660 | $179,644 | $44,000 | $135,644 |
| 2016 | $4,664 | $179,644 | $44,000 | $135,644 |
| 2015 | $4,770 | $179,644 | $44,000 | $135,644 |
| 2014 | $4,209 | $152,976 | $0 | $0 |
Source: Public Records
Map
Nearby Homes
- 4420 Nassau Way NE
- 1097 Princeton Walk NE Unit 1A
- 4030 Addie Ln Unit 5
- 1038 Seven Springs Cir
- 4503 Dobbs Crossing
- 1164 Fairfield Dr
- 861 Chestnut Lake Dr NE
- 4096 Audubon Dr Unit 4096
- 857 Chestnut Lake Dr NE Unit 3
- 4528 Lashley Ct NE
- 1195 Fielding Way
- 3948 Cliffmont Cir
- 1448 Heritage Glen Dr
- 4037 Fawn Run
- 870 Muirfield Trace
- 4232 Edgewood Ct
- 4002 Edgewood Ct Unit 9
- 4351 Cornwallis Ct NE
- 4331 Cornwallis Ct NE
- 4402 Nassau Way NE
- 4398 Nassau Way NE
- 4406 Nassau Way NE
- 4340 Cornwallis Ct NE Unit 1B
- 4394 Nassau Way NE
- 4361 Cornwallis Ct NE Unit 1B
- 4350 Cornwallis Ct NE
- 4321 Cornwallis Ct NE
- 4330 Cornwallis Ct NE
- 4410 Nassau Way NE
- 4390 Nassau Way NE Unit 2
- 4320 Cornwallis Ct NE
- 4371 Cornwallis Ct NE
- 4360 Cornwallis Ct NE
- 4386 Nassau Way NE
- 1061 Princeton Walk NE
- 1057 Princeton Walk NE
- 4407 Nassau Way NE