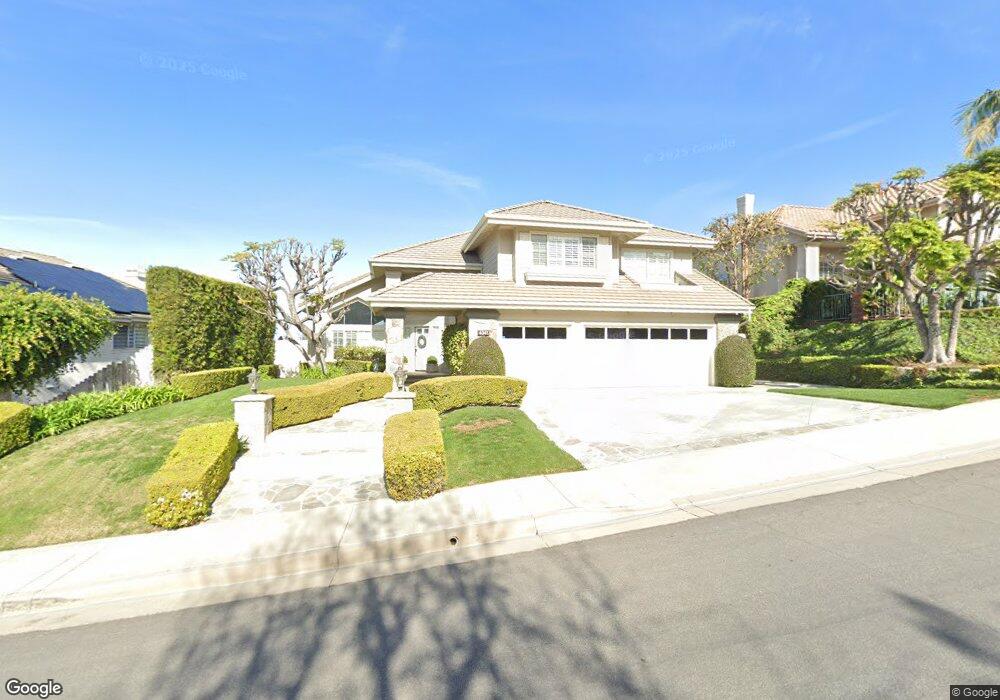
4341 E Regency Ave Orange, CA 92867
Estimated Value: $1,817,000 - $2,642,000
4
Beds
3
Baths
3,447
Sq Ft
$627/Sq Ft
Est. Value
About This Home
This home is located at 4341 E Regency Ave, Orange, CA 92867 and is currently estimated at $2,161,823, approximately $627 per square foot. 4341 E Regency Ave is a home located in Orange County with nearby schools including Nohl Canyon Elementary School, Cerro Villa Middle School, and Villa Park High School.
Ownership History
Date
Name
Owned For
Owner Type
Purchase Details
Closed on
Oct 30, 2015
Sold by
Wilson Dan R and Wilson Nancy Keffer
Bought by
Wilson Dan R and Keffer Wilson J W
Current Estimated Value
Purchase Details
Closed on
Jun 30, 1997
Sold by
Hardin Troy W
Bought by
Wilson Dan R and Wilson Nancy Keffer
Home Financials for this Owner
Home Financials are based on the most recent Mortgage that was taken out on this home.
Original Mortgage
$405,600
Outstanding Balance
$59,829
Interest Rate
7.83%
Estimated Equity
$2,101,994
Purchase Details
Closed on
Mar 10, 1993
Sold by
Standard Pacific Corp
Bought by
Hardin Troy W and Fox Catherine W
Home Financials for this Owner
Home Financials are based on the most recent Mortgage that was taken out on this home.
Original Mortgage
$388,000
Interest Rate
7.74%
Create a Home Valuation Report for This Property
The Home Valuation Report is an in-depth analysis detailing your home's value as well as a comparison with similar homes in the area
Home Values in the Area
Average Home Value in this Area
Purchase History
| Date | Buyer | Sale Price | Title Company |
|---|---|---|---|
| Wilson Dan R | -- | None Available | |
| Wilson Dan R | $507,000 | Orange Coast Title | |
| Hardin Troy W | -- | Orange Coast Title | |
| Hardin Troy W | -- | Orange Coast Title | |
| Hardin Troy W | $485,000 | First American Title Insuran |
Source: Public Records
Mortgage History
| Date | Status | Borrower | Loan Amount |
|---|---|---|---|
| Open | Wilson Dan R | $405,600 | |
| Previous Owner | Hardin Troy W | $388,000 |
Source: Public Records
Tax History
| Year | Tax Paid | Tax Assessment Tax Assessment Total Assessment is a certain percentage of the fair market value that is determined by local assessors to be the total taxable value of land and additions on the property. | Land | Improvement |
|---|---|---|---|---|
| 2025 | $8,710 | $809,550 | $357,735 | $451,815 |
| 2024 | $8,710 | $793,677 | $350,721 | $442,956 |
| 2023 | $8,518 | $778,115 | $343,844 | $434,271 |
| 2022 | $8,352 | $762,858 | $337,102 | $425,756 |
| 2021 | $8,117 | $747,900 | $330,492 | $417,408 |
| 2020 | $8,042 | $740,232 | $327,104 | $413,128 |
| 2019 | $7,938 | $725,718 | $320,690 | $405,028 |
| 2018 | $7,816 | $711,489 | $314,402 | $397,087 |
| 2017 | $7,487 | $697,539 | $308,238 | $389,301 |
| 2016 | $7,341 | $683,862 | $302,194 | $381,668 |
| 2015 | $7,233 | $673,590 | $297,655 | $375,935 |
| 2014 | $7,078 | $660,396 | $291,825 | $368,571 |
Source: Public Records
Map
Nearby Homes
- 640 S Londerry Ln
- 415 S Brook Ln
- 3624 E Shallow Brook Ln
- 18782 Peppertree Dr
- 420 S Rolling Hills Place
- 4011 E Green Clover Cir
- 9312 Smoketree Ln
- 5447 E Willowick Cir
- 9531 Lemon St
- 5598 E Stetson Ct Unit 22
- 595 S Avenida Faro
- 18262 Pamela Place
- 18811 Ridgeview Cir
- 19272 Mesa Dr
- 5810 E Mountain Loop Trail Unit 35
- 0 Cannon St
- 5573 E Vista Del Rio
- 5489 E Suncrest Rd
- 321 N Starfire St
- 18411 Hillcrest Ave
- 4403 E Regency Ave
- 4329 E Regency Ave
- 4415 E Regency Ave
- 4313 E Regency Ave
- 2820 N Roxbury St
- 4333 E Cornwall Ave
- 2788 N Roxbury St
- 2832 N Roxbury St
- 4301 E Regency Ave
- 4325 E Cornwall Ave
- 4315 E Cornwall Ave
- 2759 N Whitehall St
- 2776 N Roxbury St
- 2838 N Roxbury St
- 4305 E Cornwall Ave
- 4241 E Regency Ave
- 2825 N Roxbury St
- 2770 N Roxbury St
- 2848 N Roxbury St
- 2755 N Whitehall St
Your Personal Tour Guide
Ask me questions while you tour the home.