Estimated Value: $368,000 - $414,000
3
Beds
3
Baths
1,364
Sq Ft
$283/Sq Ft
Est. Value
About This Home
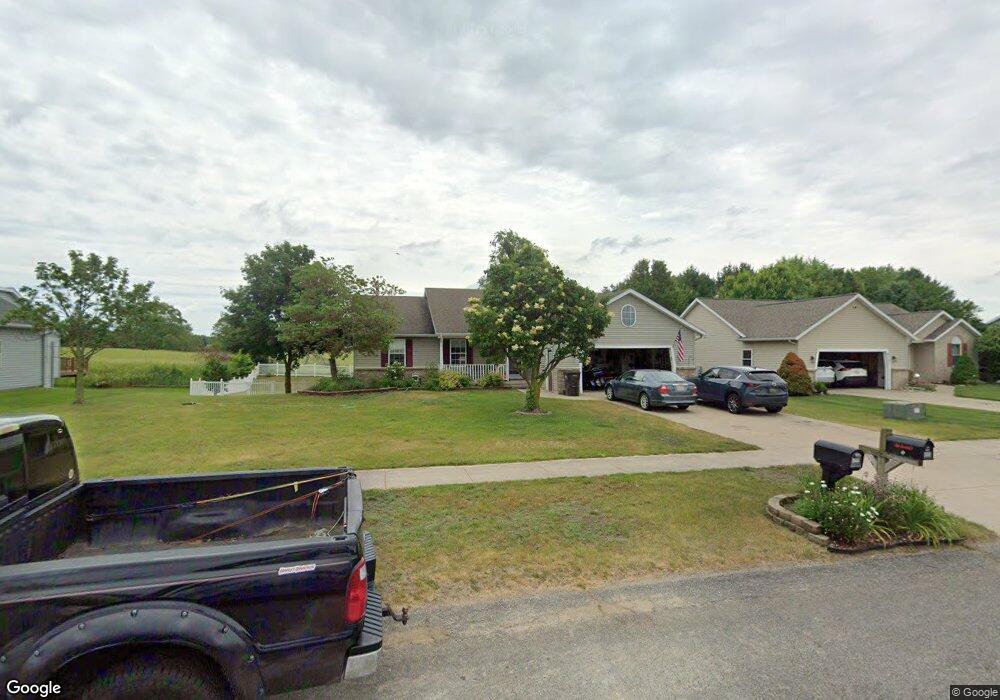
This home is located at 4341 Quail Run Dr, Dorr, MI 49323 and is currently estimated at $385,866, approximately $282 per square foot. 4341 Quail Run Dr is a home located in Allegan County with nearby schools including Wayland High School, Byron Center Charter School, and St. Stanislaus School.
Ownership History
Date
Name
Owned For
Owner Type
Purchase Details
Closed on
Dec 13, 2024
Sold by
Pepin Amy Nardin and Borris Amy
Bought by
Borris Amy
Current Estimated Value
Purchase Details
Closed on
Jan 20, 2006
Sold by
Nardin James J
Bought by
Nardin Amy
Home Financials for this Owner
Home Financials are based on the most recent Mortgage that was taken out on this home.
Original Mortgage
$163,200
Interest Rate
6.42%
Mortgage Type
Fannie Mae Freddie Mac
Purchase Details
Closed on
Sep 13, 1999
Sold by
Schaendorf William and Schaendorf Norma
Bought by
Nardin James J
Purchase Details
Closed on
Mar 5, 1999
Bought by
Schaendorf William and Schaendorf Norma
Purchase Details
Closed on
Jul 31, 1998
Sold by
Dykstra Karl W and Dykstra Linda E
Bought by
Pheasant Ridge Llc
Create a Home Valuation Report for This Property
The Home Valuation Report is an in-depth analysis detailing your home's value as well as a comparison with similar homes in the area
Home Values in the Area
Average Home Value in this Area
Purchase History
| Date | Buyer | Sale Price | Title Company |
|---|---|---|---|
| Borris Amy | -- | None Listed On Document | |
| Borris Amy | -- | None Listed On Document | |
| Nardin Amy | -- | Unified Title | |
| Nardin James J | $146,000 | -- | |
| Schaendorf William | $26,200 | -- | |
| Pheasant Ridge Llc | $215,000 | -- |
Source: Public Records
Mortgage History
| Date | Status | Borrower | Loan Amount |
|---|---|---|---|
| Previous Owner | Nardin Amy | $163,200 |
Source: Public Records
Tax History Compared to Growth
Tax History
| Year | Tax Paid | Tax Assessment Tax Assessment Total Assessment is a certain percentage of the fair market value that is determined by local assessors to be the total taxable value of land and additions on the property. | Land | Improvement |
|---|---|---|---|---|
| 2025 | $3,024 | $165,300 | $37,900 | $127,400 |
| 2024 | $2,751 | $155,800 | $32,900 | $122,900 |
| 2023 | $2,817 | $136,100 | $30,200 | $105,900 |
| 2022 | $2,751 | $117,800 | $25,800 | $92,000 |
| 2021 | $2,586 | $114,800 | $26,900 | $87,900 |
| 2020 | $2,462 | $112,900 | $24,700 | $88,200 |
| 2019 | $2,462 | $100,900 | $24,700 | $76,200 |
| 2018 | $2,406 | $98,700 | $16,000 | $82,700 |
| 2017 | $0 | $101,100 | $16,000 | $85,100 |
| 2016 | $0 | $86,200 | $16,000 | $70,200 |
| 2015 | -- | $86,200 | $16,000 | $70,200 |
| 2014 | -- | $79,700 | $15,700 | $64,000 |
| 2013 | -- | $72,300 | $15,700 | $56,600 |
Source: Public Records
Map
Nearby Homes
- 1722 144th Ave
- 1341 142nd Ave
- 4159 White Pine Dr
- 2081 142nd Ave
- 4087 Ronalds Rd
- 4101 White Pine Dr Unit 4
- 4312 Woodside Meadow Ct
- 1659 Creek Side Ct
- 10591 Byron Center Ave SW
- Lot 11 Walnut Dale Dr
- 10780 Windward Ave SW
- 10785 Windward Ave SW
- 1069 108th St SW
- 10725 Windward Ave SW
- 10711 Windward Ave SW
- 4351 Hickory View Ct
- 136 100th St SW
- 737 100th St SW
- V/L Ivanrest Ave SW
- 4335 Tavistock Dr
- 4340 Quail Run Dr
- 4345 Quail Run Dr
- 4337 Quail Run Dr
- 1836 Quail Ridge Dr
- 4336 Quail Run Dr
- 4333 Quail Run Dr
- 4349 Quail Run Dr
- 4332 Quail Run Dr
- 1840 Quail Ridge Dr
- 4329 Quail Run Dr
- 1831 Quail Ridge Dr
- 1835 Quail Ridge Dr
- 4335 Pheasant Run Dr
- 1833 Pheasant Ridge Dr
- 4339 Pheasant Run Dr
- 4331 Pheasant Run Dr
- 1839 Quail Ridge Dr
- 4325 Quail Run Dr
- 4352 Saturn Dr
- 1837 Pheasant Ridge Dr