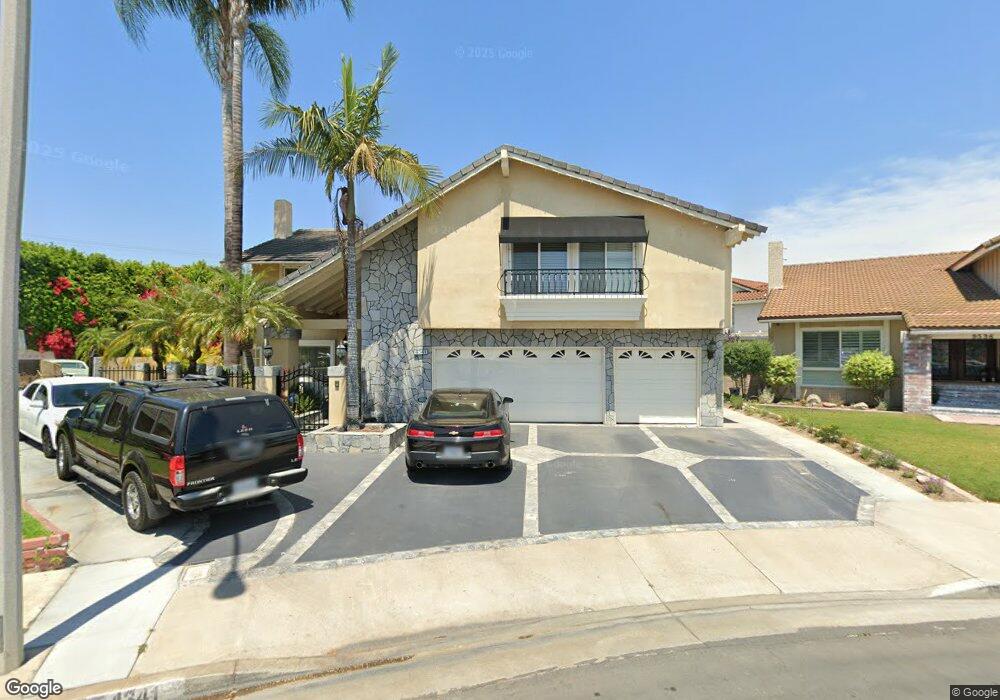
4341 Via Norte Cypress, CA 90630
Estimated Value: $1,318,000 - $1,605,000
6
Beds
3
Baths
2,698
Sq Ft
$556/Sq Ft
Est. Value
About This Home
This home is located at 4341 Via Norte, Cypress, CA 90630 and is currently estimated at $1,498,836, approximately $555 per square foot. 4341 Via Norte is a home located in Orange County with nearby schools including Margaret Landell Elementary School, A.E. Arnold Elementary School, and Lexington Junior High School.
Ownership History
Date
Name
Owned For
Owner Type
Purchase Details
Closed on
May 9, 1996
Sold by
The Prudential Home Mtg Company Inc
Bought by
Lourenco Moses D and Lourenco Maria D
Current Estimated Value
Home Financials for this Owner
Home Financials are based on the most recent Mortgage that was taken out on this home.
Original Mortgage
$222,400
Outstanding Balance
$12,441
Interest Rate
7.8%
Estimated Equity
$1,486,395
Purchase Details
Closed on
Mar 15, 1996
Sold by
Cohen Gerald A and Cohen Shelly L
Bought by
The Prudential Home Mtg Company Inc
Home Financials for this Owner
Home Financials are based on the most recent Mortgage that was taken out on this home.
Original Mortgage
$222,400
Outstanding Balance
$12,441
Interest Rate
7.8%
Estimated Equity
$1,486,395
Purchase Details
Closed on
Jun 12, 1995
Sold by
Cohen Gerald A and Cohen Shelly L
Bought by
New England Financial Corp
Create a Home Valuation Report for This Property
The Home Valuation Report is an in-depth analysis detailing your home's value as well as a comparison with similar homes in the area
Home Values in the Area
Average Home Value in this Area
Purchase History
| Date | Buyer | Sale Price | Title Company |
|---|---|---|---|
| Lourenco Moses D | $278,000 | North American Title Co | |
| The Prudential Home Mtg Company Inc | $279,000 | First American Title Ins Co | |
| New England Financial Corp | -- | -- |
Source: Public Records
Mortgage History
| Date | Status | Borrower | Loan Amount |
|---|---|---|---|
| Open | Lourenco Moses D | $222,400 |
Source: Public Records
Tax History Compared to Growth
Tax History
| Year | Tax Paid | Tax Assessment Tax Assessment Total Assessment is a certain percentage of the fair market value that is determined by local assessors to be the total taxable value of land and additions on the property. | Land | Improvement |
|---|---|---|---|---|
| 2025 | $5,232 | $461,823 | $241,785 | $220,038 |
| 2024 | $5,232 | $452,768 | $237,044 | $215,724 |
| 2023 | $5,111 | $443,891 | $232,396 | $211,495 |
| 2022 | $5,049 | $435,188 | $227,839 | $207,349 |
| 2021 | $4,982 | $426,655 | $223,371 | $203,284 |
| 2020 | $4,962 | $422,281 | $221,081 | $201,200 |
| 2019 | $4,823 | $414,001 | $216,746 | $197,255 |
| 2018 | $4,757 | $405,884 | $212,496 | $193,388 |
| 2017 | $4,594 | $397,926 | $208,329 | $189,597 |
| 2016 | $4,554 | $390,124 | $204,244 | $185,880 |
| 2015 | $4,520 | $384,264 | $201,176 | $183,088 |
| 2014 | $4,281 | $376,737 | $197,235 | $179,502 |
Source: Public Records
Map
Nearby Homes
- 4326 Via Verde
- 4112 Avenida Sevilla
- 9824 Via Sonoma
- 4644 Portofino Cir
- 9686 Bloomfield Ave
- 22221 Bloomfield Ave Unit 47
- 3621 Halbrite Ave
- 4790 Montefino Dr
- 9080 Bloomfield Ave Unit 237
- 9080 Bloomfield Ave Unit 167
- 9080 Bloomfield Ave Unit 79
- 9080 Bloomfield Ave Unit 126
- 9080 Bloomfield Ave Unit 33
- 9080 Bloomfield Ave Unit 209
- 9080 Bloomfield Ave Unit 77
- 9080 Bloomfield Ave Unit 135
- 9080 Bloomfield St Unit 231
- 9080 Bloomfield St Unit 145
- 4177 Elizabeth Ct
- 9574 Tivoli Cir
- 9536 Avenida Monterey
- 4329 Via Norte
- 9551 Westbourne Ct
- 9541 Westbourne Ct
- 4315 Via Norte
- 9550 Avenida Monterey
- 4322 Via Norte
- 9561 Westbourne Ct
- 4301 Via Norte
- 4306 Via Norte
- 9562 Avenida Monterey
- 9571 Westbourne Ct
- 4323 Via Verde
- 9540 Westbourne Ct
- 4290 Via Norte
- 4307 Via Verde
- 9576 Avenida Monterey
- 9581 Westbourne Ct
- 9550 Westbourne Ct
- 9560 Westbourne Ct