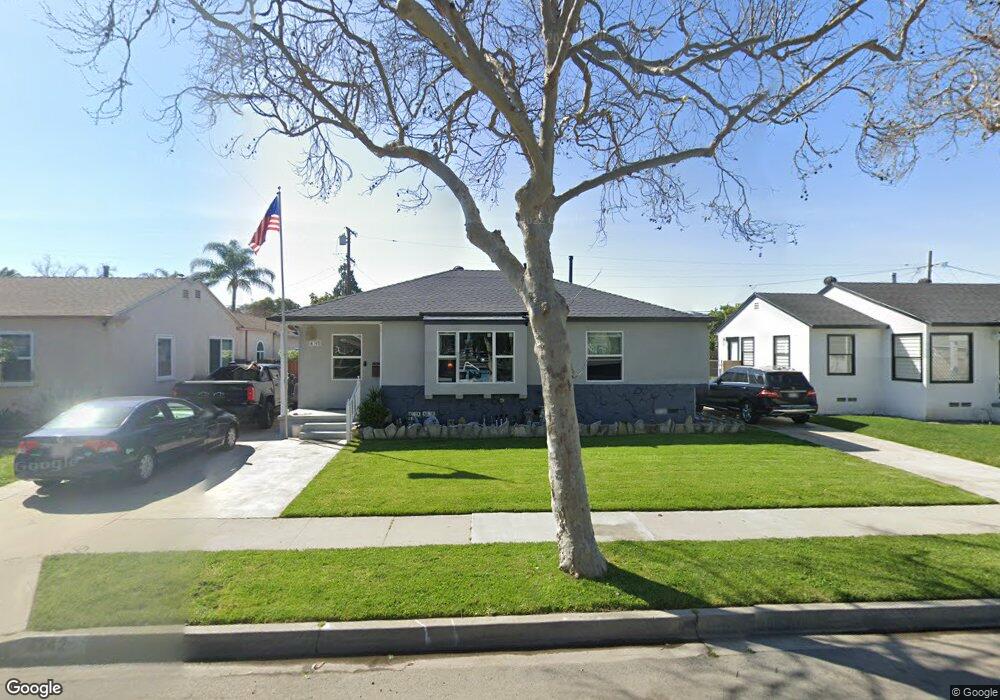
4342 Hedda St Lakewood, CA 90712
Mayfair NeighborhoodEstimated Value: $781,735 - $931,000
3
Beds
1
Bath
1,021
Sq Ft
$822/Sq Ft
Est. Value
About This Home
This home is located at 4342 Hedda St, Lakewood, CA 90712 and is currently estimated at $839,434, approximately $822 per square foot. 4342 Hedda St is a home located in Los Angeles County with nearby schools including Stephen Foster Elementary School, Mayfair High School, and St. Pancratius Parish School.
Ownership History
Date
Name
Owned For
Owner Type
Purchase Details
Closed on
Jan 30, 2002
Sold by
Thompson William J
Bought by
Estrada Ross and Estrada Gina
Current Estimated Value
Home Financials for this Owner
Home Financials are based on the most recent Mortgage that was taken out on this home.
Original Mortgage
$213,100
Interest Rate
6.84%
Purchase Details
Closed on
Feb 18, 1997
Sold by
Thompson Angel
Bought by
Thompson William J
Home Financials for this Owner
Home Financials are based on the most recent Mortgage that was taken out on this home.
Original Mortgage
$147,250
Interest Rate
7.81%
Purchase Details
Closed on
Jan 21, 1997
Sold by
Harbison Louis L
Bought by
Thompson William J
Home Financials for this Owner
Home Financials are based on the most recent Mortgage that was taken out on this home.
Original Mortgage
$147,250
Interest Rate
7.81%
Create a Home Valuation Report for This Property
The Home Valuation Report is an in-depth analysis detailing your home's value as well as a comparison with similar homes in the area
Home Values in the Area
Average Home Value in this Area
Purchase History
| Date | Buyer | Sale Price | Title Company |
|---|---|---|---|
| Estrada Ross | $266,500 | First Southwestern Title Co | |
| Thompson William J | -- | Chicago Title | |
| Thompson William J | $155,000 | Chicago Title Co |
Source: Public Records
Mortgage History
| Date | Status | Borrower | Loan Amount |
|---|---|---|---|
| Previous Owner | Estrada Ross | $213,100 | |
| Previous Owner | Thompson William J | $147,250 | |
| Closed | Estrada Ross | $53,200 |
Source: Public Records
Tax History Compared to Growth
Tax History
| Year | Tax Paid | Tax Assessment Tax Assessment Total Assessment is a certain percentage of the fair market value that is determined by local assessors to be the total taxable value of land and additions on the property. | Land | Improvement |
|---|---|---|---|---|
| 2025 | $4,932 | $393,531 | $293,971 | $99,560 |
| 2024 | $4,932 | $385,815 | $288,207 | $97,608 |
| 2023 | $4,733 | $378,251 | $282,556 | $95,695 |
| 2022 | $4,643 | $370,835 | $277,016 | $93,819 |
| 2021 | $4,544 | $363,565 | $271,585 | $91,980 |
| 2019 | $4,428 | $352,783 | $263,531 | $89,252 |
| 2018 | $4,242 | $345,866 | $258,364 | $87,502 |
| 2016 | $4,075 | $332,438 | $248,333 | $84,105 |
| 2015 | $3,992 | $327,445 | $244,603 | $82,842 |
| 2014 | $3,941 | $321,032 | $239,812 | $81,220 |
Source: Public Records
Map
Nearby Homes
- 6034 Pepperwood Ave
- 5944 Blackthorne Ave
- 4342 Arabella St
- 6062 Pimenta Ave
- 6107 Faculty Ave
- 4814 Hedda St
- 6142 Oliva Ave
- 5839 Faculty Ave
- 6023 Whitewood Ave
- 5672 Pepperwood Ave
- 3806 E Arabella St
- 17820 Lakewood Blvd Unit 30
- 17820 Lakewood Blvd Unit 3
- 3711 E Hedda St
- 9112 Cedar St
- 9253 Rose St
- 5134 Ashworth St
- 5817 Fidler Ave
- 17458 Deerfield Ave
- 17441 Virginia Ave Unit E
- 4336 Hedda St
- 4402 Hedda St
- 4332 Hedda St
- 4408 Hedda St
- 4343 Hungerford St
- 4339 Hungerford St
- 4403 Hungerford St
- 4333 Hungerford St
- 4409 Hungerford St
- 4326 Hedda St
- 6003 Bonfair Ave
- 6002 Bonfair Ave
- 4412 Hedda St
- 5969 Blackthorne Ave
- 4327 Hungerford St
- 5963 Blackthorne Ave
- 4405 Hungerford St
- 6008 Bonfair Ave
- 6009 Bonfair Ave
- 5970 Pepperwood Ave