4342 W Thomas St Unit 44 Chicago, IL 60651
West Humboldt Park NeighborhoodEstimated Value: $293,000 - $532,000
4
Beds
2
Baths
2,080
Sq Ft
$198/Sq Ft
Est. Value
About This Home
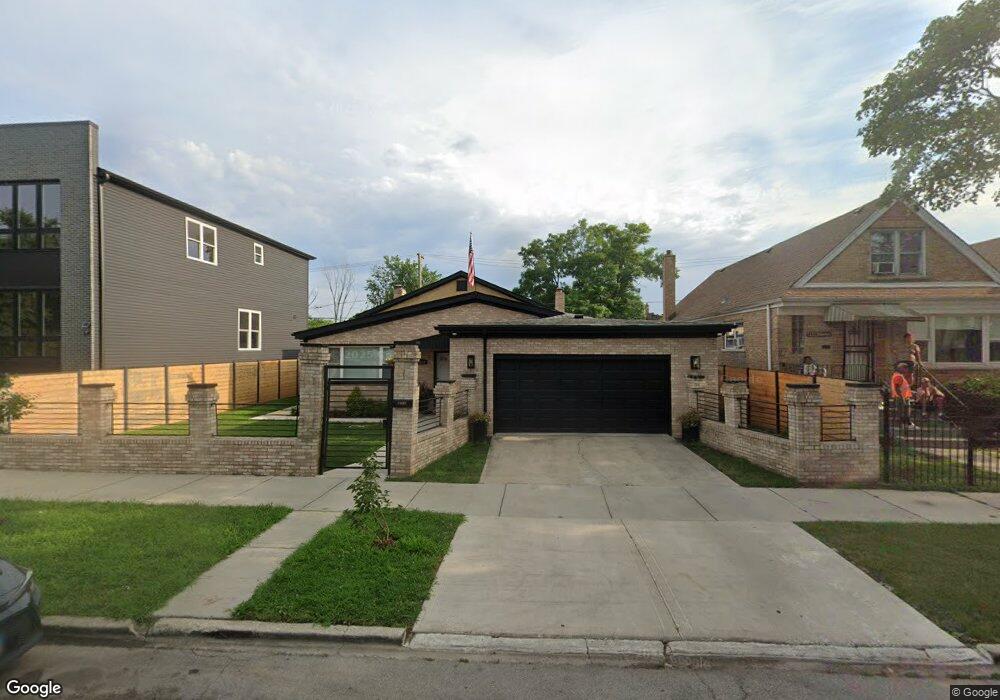
This home is located at 4342 W Thomas St Unit 44, Chicago, IL 60651 and is currently estimated at $412,157, approximately $198 per square foot. 4342 W Thomas St Unit 44 is a home located in Cook County with nearby schools including Brian Piccolo Elementary School, Orr Academy High School, and KIPP One Academy.
Ownership History
Date
Name
Owned For
Owner Type
Purchase Details
Closed on
Mar 31, 2022
Sold by
Rmf Buyout Acquisition Trust
Bought by
Broad Street Funding Trust and Wilmington Trust Na
Current Estimated Value
Purchase Details
Closed on
Nov 21, 2019
Sold by
Galvin Jimmie N
Bought by
Wilmington Savings Fund Society Fsb and Rmf Buyout Acquisition Trust 2018 1
Purchase Details
Closed on
Jun 30, 1997
Sold by
Galvin Jimmie N and Harris Joyce A
Bought by
Galvin Jimmie N
Purchase Details
Closed on
Jun 22, 1995
Sold by
Galvin Jimmie N and Harris Joyce A
Bought by
Turner Dimitris G and Galvin Lashonda
Home Financials for this Owner
Home Financials are based on the most recent Mortgage that was taken out on this home.
Original Mortgage
$5,000
Interest Rate
8.26%
Purchase Details
Closed on
May 31, 1995
Sold by
Pytel Joseph and Pytel Thaiz
Bought by
Galvin Jimmie N and Harris Joyce A
Home Financials for this Owner
Home Financials are based on the most recent Mortgage that was taken out on this home.
Original Mortgage
$5,000
Interest Rate
8.26%
Create a Home Valuation Report for This Property
The Home Valuation Report is an in-depth analysis detailing your home's value as well as a comparison with similar homes in the area
Home Values in the Area
Average Home Value in this Area
Purchase History
| Date | Buyer | Sale Price | Title Company |
|---|---|---|---|
| Broad Street Funding Trust | -- | None Listed On Document | |
| Wilmington Savings Fund Society Fsb | -- | Attorney | |
| Galvin Jimmie N | -- | -- | |
| Turner Dimitris G | -- | -- | |
| Galvin Jimmie N | $12,000 | -- |
Source: Public Records
Mortgage History
| Date | Status | Borrower | Loan Amount |
|---|---|---|---|
| Previous Owner | Galvin Jimmie N | $5,000 |
Source: Public Records
Tax History Compared to Growth
Tax History
| Year | Tax Paid | Tax Assessment Tax Assessment Total Assessment is a certain percentage of the fair market value that is determined by local assessors to be the total taxable value of land and additions on the property. | Land | Improvement |
|---|---|---|---|---|
| 2024 | $2,358 | $16,329 | $5,657 | $10,672 |
| 2023 | $2,292 | $11,144 | $4,525 | $6,619 |
| 2022 | $2,292 | $11,144 | $4,525 | $6,619 |
| 2021 | $2,241 | $11,143 | $4,525 | $6,618 |
| 2020 | $3,736 | $16,772 | $5,279 | $11,493 |
| 2019 | $3,786 | $18,845 | $5,279 | $13,566 |
| 2018 | $3,723 | $18,845 | $5,279 | $13,566 |
| 2017 | $2,923 | $13,576 | $4,713 | $8,863 |
| 2016 | $2,719 | $13,576 | $4,713 | $8,863 |
| 2015 | $4,550 | $24,829 | $4,713 | $20,116 |
| 2014 | $4,406 | $23,749 | $4,525 | $19,224 |
| 2013 | $4,319 | $23,749 | $4,525 | $19,224 |
Source: Public Records
Map
Nearby Homes
- 4348 W Thomas St
- 4355 W Thomas St
- 4400 W Cortez St
- 4247 W Haddon Ave
- 4408 W Cortez St
- 4345-57 W Haddon Ave
- 4258 W Augusta Blvd
- 4256 W Augusta Blvd
- 4224 W Thomas St
- 4241 W Crystal St
- 1011 N Keeler Ave
- 4241 W Walton St
- 4502 W Thomas St
- 1047 N Kedvale Ave
- 850 N Kildare Ave
- 5404 W Walton St
- 4440 W Iowa St
- 937 N Kedvale Ave
- 853 N Keeler Ave
- 4222 W Division St
- 4342 W Thomas St
- 4338 W Thomas St
- 4336 W Thomas St
- 4332 W Thomas St
- 4350 W Thomas St Unit 1
- 4350 W Thomas St
- 4330 W Thomas St
- 4330 W Thomas St
- 4354 W Thomas St
- 4354 W Thomas St
- 4339 W Haddon Ave
- 4326 W Thomas St
- 1103 N Kostner Ave
- 1103 N Kostner Ave
- 4324 W Thomas St
- 4337 W Haddon Ave Unit 1
- 4331 W Haddon Ave
- 4331 W Haddon Ave
- 4333 W Haddon Ave Unit 1
- 4333 W Haddon Ave