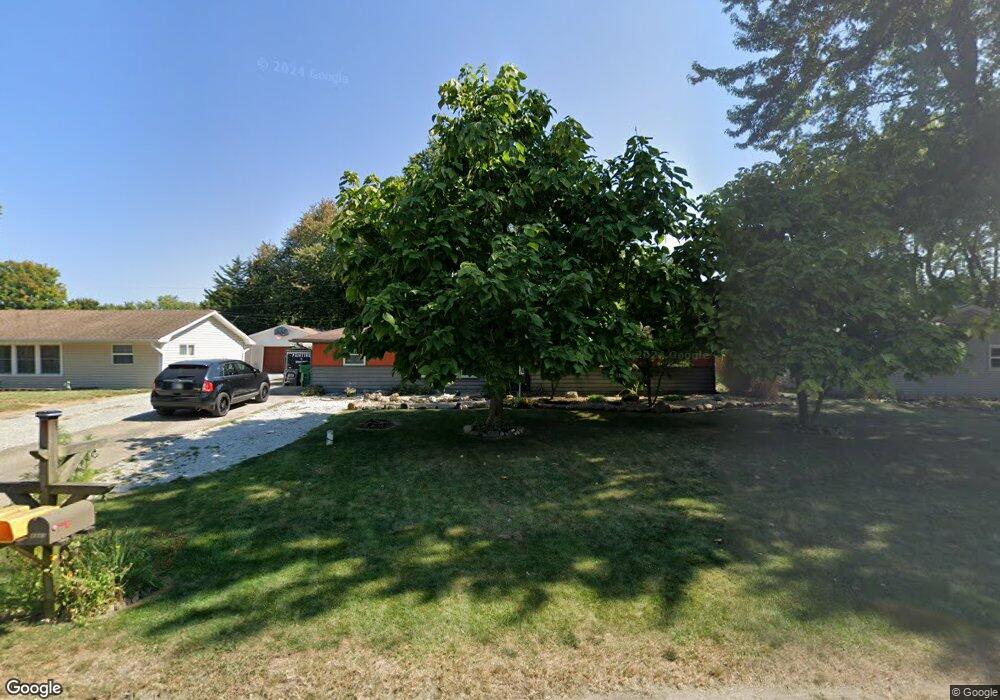
4343 Allen Dr Brownsburg, IN 46112
Estimated Value: $225,000 - $244,000
4
Beds
2
Baths
1,364
Sq Ft
$173/Sq Ft
Est. Value
About This Home
This home is located at 4343 Allen Dr, Brownsburg, IN 46112 and is currently estimated at $236,483, approximately $173 per square foot. 4343 Allen Dr is a home located in Hendricks County with nearby schools including Cardinal Elementary School, Brownsburg West Middle School, and Brownsburg High School.
Ownership History
Date
Name
Owned For
Owner Type
Purchase Details
Closed on
Nov 18, 2011
Sold by
Goingcorp
Bought by
Mace Katie L
Current Estimated Value
Home Financials for this Owner
Home Financials are based on the most recent Mortgage that was taken out on this home.
Original Mortgage
$95,248
Outstanding Balance
$65,263
Interest Rate
4.12%
Mortgage Type
FHA
Estimated Equity
$171,220
Purchase Details
Closed on
Jul 18, 2011
Sold by
Secretary Of Housing & Urban Development
Bought by
Goingcorp
Home Financials for this Owner
Home Financials are based on the most recent Mortgage that was taken out on this home.
Original Mortgage
$58,000
Interest Rate
4.53%
Mortgage Type
Purchase Money Mortgage
Purchase Details
Closed on
Jul 15, 2010
Sold by
Us Bank Home Mortgage
Bought by
The Secretary Of Housing & Urban Develop
Create a Home Valuation Report for This Property
The Home Valuation Report is an in-depth analysis detailing your home's value as well as a comparison with similar homes in the area
Home Values in the Area
Average Home Value in this Area
Purchase History
| Date | Buyer | Sale Price | Title Company |
|---|---|---|---|
| Mace Katie L | -- | None Available | |
| Goingcorp | -- | None Available | |
| The Secretary Of Housing & Urban Develop | -- | None Available | |
| Universal Mortgage Corporation | $104,847 | None Available |
Source: Public Records
Mortgage History
| Date | Status | Borrower | Loan Amount |
|---|---|---|---|
| Open | Mace Katie L | $95,248 | |
| Previous Owner | Goingcorp | $58,000 |
Source: Public Records
Tax History Compared to Growth
Tax History
| Year | Tax Paid | Tax Assessment Tax Assessment Total Assessment is a certain percentage of the fair market value that is determined by local assessors to be the total taxable value of land and additions on the property. | Land | Improvement |
|---|---|---|---|---|
| 2024 | $1,846 | $193,300 | $29,900 | $163,400 |
| 2023 | $1,726 | $169,000 | $26,700 | $142,300 |
| 2022 | $1,617 | $163,000 | $25,300 | $137,700 |
| 2021 | $1,373 | $142,500 | $23,600 | $118,900 |
| 2020 | $1,360 | $140,300 | $23,600 | $116,700 |
| 2019 | $893 | $113,200 | $22,600 | $90,600 |
| 2018 | $866 | $110,000 | $22,600 | $87,400 |
| 2017 | $816 | $105,200 | $22,000 | $83,200 |
| 2016 | $762 | $101,300 | $22,000 | $79,300 |
| 2014 | $748 | $98,000 | $21,300 | $76,700 |
Source: Public Records
Map
Nearby Homes
- 4285 Varner Rd
- 4369 Aspen Dr
- 10270 E County Road 450 N
- 4430 Chatham Dr
- 4375 Round Lake Bend
- 10925 E County Road 450 N
- 9250 Ratcliff Ct
- 11000 E Us Highway 136
- 4080 Tansel Rd
- 1844 Creekside Dr
- 3951 Tansel Rd
- 8915 E County Road 400 N
- 6527 Gulfwood Dr
- 10611 Armstead Ave
- 3747 Bellmore Dr
- 10145 Eagle Eye Way
- 3924 Castle Hill Dr
- 3717 Bellmore Dr
- 3695 Bellmore Dr
- 1560 Cold Spring Dr