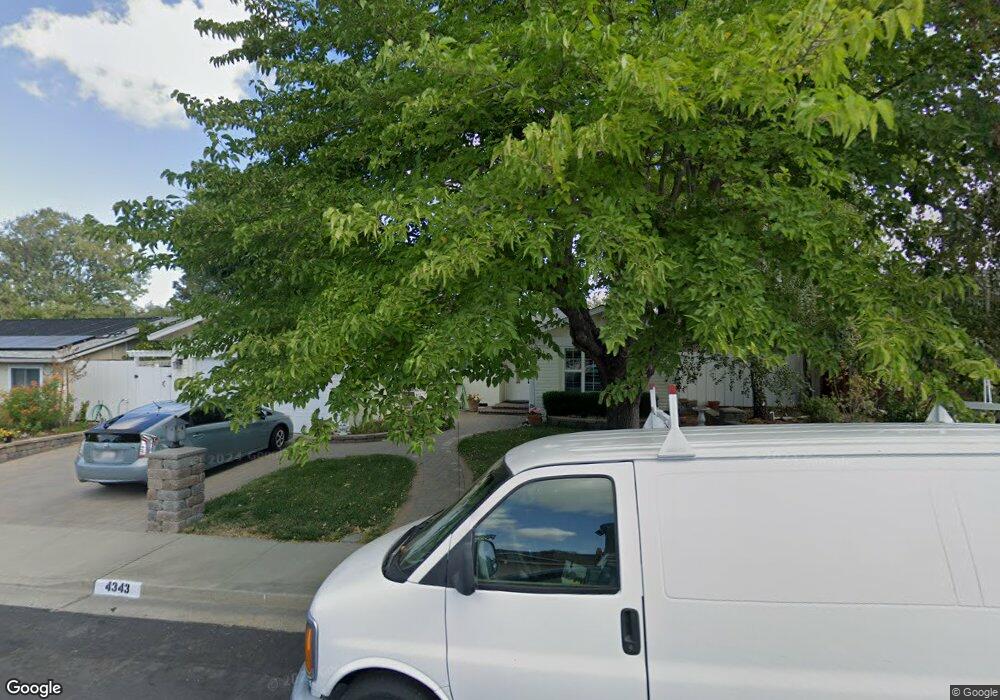
4343 Blenheim Way Concord, CA 94521
Midtown Concord NeighborhoodEstimated Value: $723,128 - $878,000
3
Beds
2
Baths
1,357
Sq Ft
$585/Sq Ft
Est. Value
About This Home
This home is located at 4343 Blenheim Way, Concord, CA 94521 and is currently estimated at $793,532, approximately $584 per square foot. 4343 Blenheim Way is a home located in Contra Costa County with nearby schools including Woodside Elementary School, Oak Grove Middle School, and Ygnacio Valley High School.
Ownership History
Date
Name
Owned For
Owner Type
Purchase Details
Closed on
Aug 6, 2004
Sold by
Moser Frank and Moser Danielle
Bought by
Moser Frank and Moser Danielle
Current Estimated Value
Purchase Details
Closed on
Jul 11, 2003
Sold by
Moser Frank and Moser Danielle
Bought by
Moser Frank and Moser Danielle
Home Financials for this Owner
Home Financials are based on the most recent Mortgage that was taken out on this home.
Original Mortgage
$230,000
Interest Rate
5.18%
Mortgage Type
Purchase Money Mortgage
Purchase Details
Closed on
Oct 27, 1998
Sold by
Moser Frank E and Moser Danielle M
Bought by
Moser Frank and Moser Danielle
Create a Home Valuation Report for This Property
The Home Valuation Report is an in-depth analysis detailing your home's value as well as a comparison with similar homes in the area
Home Values in the Area
Average Home Value in this Area
Purchase History
| Date | Buyer | Sale Price | Title Company |
|---|---|---|---|
| Moser Frank | -- | -- | |
| Moser Frank | -- | -- | |
| Moser Frank | -- | Placer Title | |
| Moser Frank | -- | -- |
Source: Public Records
Mortgage History
| Date | Status | Borrower | Loan Amount |
|---|---|---|---|
| Previous Owner | Moser Frank | $230,000 |
Source: Public Records
Tax History Compared to Growth
Tax History
| Year | Tax Paid | Tax Assessment Tax Assessment Total Assessment is a certain percentage of the fair market value that is determined by local assessors to be the total taxable value of land and additions on the property. | Land | Improvement |
|---|---|---|---|---|
| 2025 | $3,368 | $229,966 | $101,543 | $128,423 |
| 2024 | $3,286 | $225,457 | $99,552 | $125,905 |
| 2023 | $3,286 | $221,037 | $97,600 | $123,437 |
| 2022 | $3,221 | $216,704 | $95,687 | $121,017 |
| 2021 | $3,125 | $212,456 | $93,811 | $118,645 |
| 2019 | $3,051 | $206,157 | $91,030 | $115,127 |
| 2018 | $2,925 | $202,116 | $89,246 | $112,870 |
| 2017 | $2,813 | $198,154 | $87,497 | $110,657 |
| 2016 | $2,711 | $194,270 | $85,782 | $108,488 |
| 2015 | $2,653 | $191,353 | $84,494 | $106,859 |
| 2014 | $2,581 | $187,605 | $82,839 | $104,766 |
Source: Public Records
Map
Nearby Homes
- 4317 Cowell Rd
- 4380 Saint Charles Place
- 4495 Wildberry Ct
- 4362 Lynn Dr
- 1158 Saint Matthew Place Unit 107
- 4119 Churchill Dr
- 4058 Treat Blvd
- 1450 Bel Air Dr Unit 110
- 1187 Kaski Ln
- 4044 Cowell Rd
- 1337 Cape Cod Way
- 4403 Winterberry Ct
- 1435 Bel Air Dr Unit C
- 1381 Rosal Ln
- 1459 Wharton Way Unit C
- 4597 Wildcat Ln
- 1170 Green Gables Ct
- 1221 Mcewing Ct
- 4655 Melody Dr Unit A
- 4398 N Canoe Birch Ct
- 4339 Blenheim Way
- 4347 Blenheim Way
- 1263 Stephanie Ct
- 4337 Stephanie Dr
- 4342 Blenheim Way
- 4335 Blenheim Way
- 4346 Blenheim Way
- 4333 Stephanie Dr
- 4338 Blenheim Way
- 1267 Stephanie Ct
- 4350 Blenheim Way
- 4341 Stephanie Dr
- 4334 Blenheim Way
- 4331 Blenheim Way
- 1258 Stephanie Ct
- 4345 Stephanie Dr
- 4339 Chelsea Way
- 4343 Chelsea Way
- 4329 Stephanie Dr
- 1260 Blenheim Ln