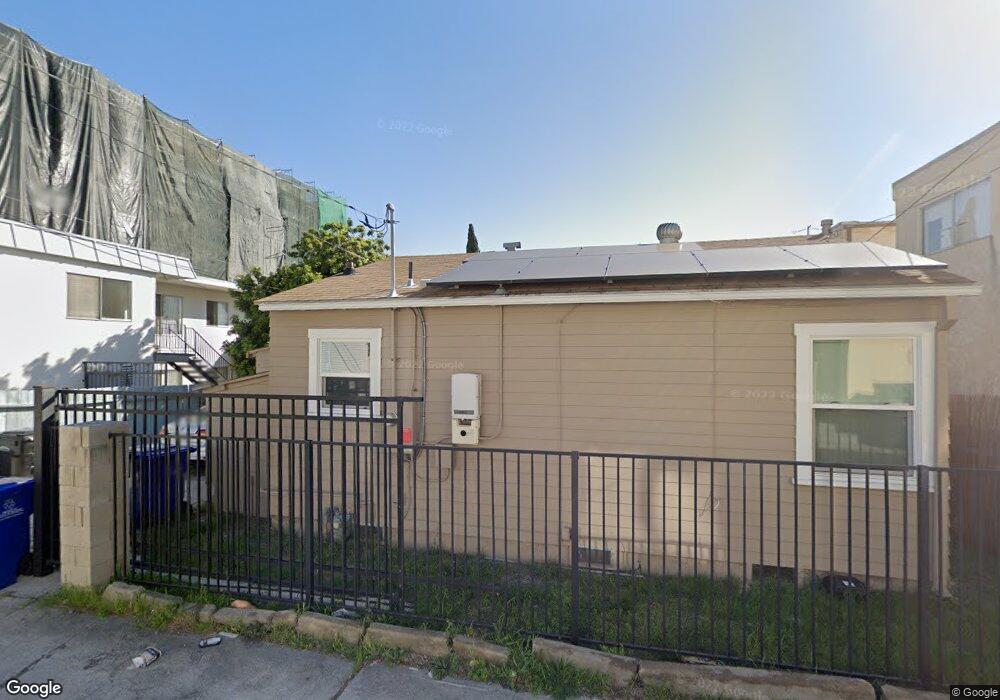
4344 Utah St San Diego, CA 92104
North Park NeighborhoodEstimated Value: $672,000 - $794,000
2
Beds
1
Bath
632
Sq Ft
$1,197/Sq Ft
Est. Value
About This Home
This home is located at 4344 Utah St, San Diego, CA 92104 and is currently estimated at $756,281, approximately $1,196 per square foot. 4344 Utah St is a home located in San Diego County with nearby schools including Garfield Elementary, Roosevelt International Middle School, and North Park Christian School.
Ownership History
Date
Name
Owned For
Owner Type
Purchase Details
Closed on
Sep 11, 2020
Sold by
Chang Eunice Y and Chang Eunice
Bought by
Chang Eunice Y
Current Estimated Value
Home Financials for this Owner
Home Financials are based on the most recent Mortgage that was taken out on this home.
Original Mortgage
$328,000
Outstanding Balance
$290,538
Interest Rate
2.8%
Mortgage Type
New Conventional
Estimated Equity
$465,743
Purchase Details
Closed on
Sep 4, 2019
Sold by
Burns Dale E and Dale E Burns Living Trust
Bought by
Chang Eunice
Home Financials for this Owner
Home Financials are based on the most recent Mortgage that was taken out on this home.
Original Mortgage
$318,750
Interest Rate
3.7%
Purchase Details
Closed on
Jan 12, 2010
Sold by
Burns Dale E
Bought by
Burns Dale E
Purchase Details
Closed on
Nov 30, 2006
Sold by
Burns Dale
Bought by
Burns Dale
Purchase Details
Closed on
Jan 26, 2005
Sold by
Burns Lorraine M
Bought by
Burns Lorraine
Create a Home Valuation Report for This Property
The Home Valuation Report is an in-depth analysis detailing your home's value as well as a comparison with similar homes in the area
Home Values in the Area
Average Home Value in this Area
Purchase History
| Date | Buyer | Sale Price | Title Company |
|---|---|---|---|
| Chang Eunice Y | -- | Corinthian Title Company | |
| Chang Eunice | $425,000 | Corinthian Title Company | |
| Burns Dale E | -- | None Available | |
| Burns Dale | -- | None Available | |
| Burns Lorraine | -- | -- |
Source: Public Records
Mortgage History
| Date | Status | Borrower | Loan Amount |
|---|---|---|---|
| Open | Chang Eunice Y | $328,000 | |
| Previous Owner | Chang Eunice | $318,750 |
Source: Public Records
Tax History Compared to Growth
Tax History
| Year | Tax Paid | Tax Assessment Tax Assessment Total Assessment is a certain percentage of the fair market value that is determined by local assessors to be the total taxable value of land and additions on the property. | Land | Improvement |
|---|---|---|---|---|
| 2025 | $5,663 | $464,795 | $382,774 | $82,021 |
| 2024 | $5,663 | $455,682 | $375,269 | $80,413 |
| 2023 | $5,537 | $446,748 | $367,911 | $78,837 |
| 2022 | $5,389 | $437,990 | $360,698 | $77,292 |
| 2021 | $5,351 | $429,403 | $353,626 | $75,777 |
| 2020 | $5,286 | $425,000 | $350,000 | $75,000 |
| 2019 | $934 | $71,024 | $20,284 | $50,740 |
| 2018 | $875 | $69,633 | $19,887 | $49,746 |
| 2017 | $83 | $68,269 | $19,498 | $48,771 |
| 2016 | $839 | $66,931 | $19,116 | $47,815 |
| 2015 | $827 | $65,926 | $18,829 | $47,097 |
| 2014 | $815 | $64,636 | $18,461 | $46,175 |
Source: Public Records
Map
Nearby Homes
- 4355 Utah St Unit 2
- 4367 Idaho St Unit 5
- 4226 Utah St
- 4381 Oregon St Unit 6
- 4432 Kansas St Unit C
- 4347 30th St Unit 53
- 4153-55 Utah St
- 4366 Ohio St
- 4119-23 Kansas
- 4473 30th St Unit 506
- 4473 30th St Unit 218
- 4473 30th St Unit 505
- 4473 30th St Unit 402
- 4205 Ohio St Unit 204
- 4205 Ohio St Unit 106
- 4075 Idaho St Unit 2
- 4146 Hamilton St Unit 19
- 4074 30th St
- 4043 Utah St Unit 8
- 4043 Utah St Unit 3
- 4334-40 Utah St
- 4354 Utah St
- 4346 Utah St
- 4334 Utah St
- 4360 Utah St
- 4330 Utah St Unit 5
- 4330 Utah St Unit 4
- 4330 Utah St Unit 3
- 4330 Utah St Unit 2
- 4330 Utah St Unit 1
- 4330 Utah St Unit 7
- 4330 Utah St Unit 6
- 4341 1/2 Idaho St
- 4333 Idaho St Unit 37
- 4349-55 Idaho St
- 4343 Idaho St
- 4337 Idaho St #101 Unit 101
- 4337 Idaho St Unit 105
- 4337 Idaho St Unit 103
- 4337 Idaho St Unit 101