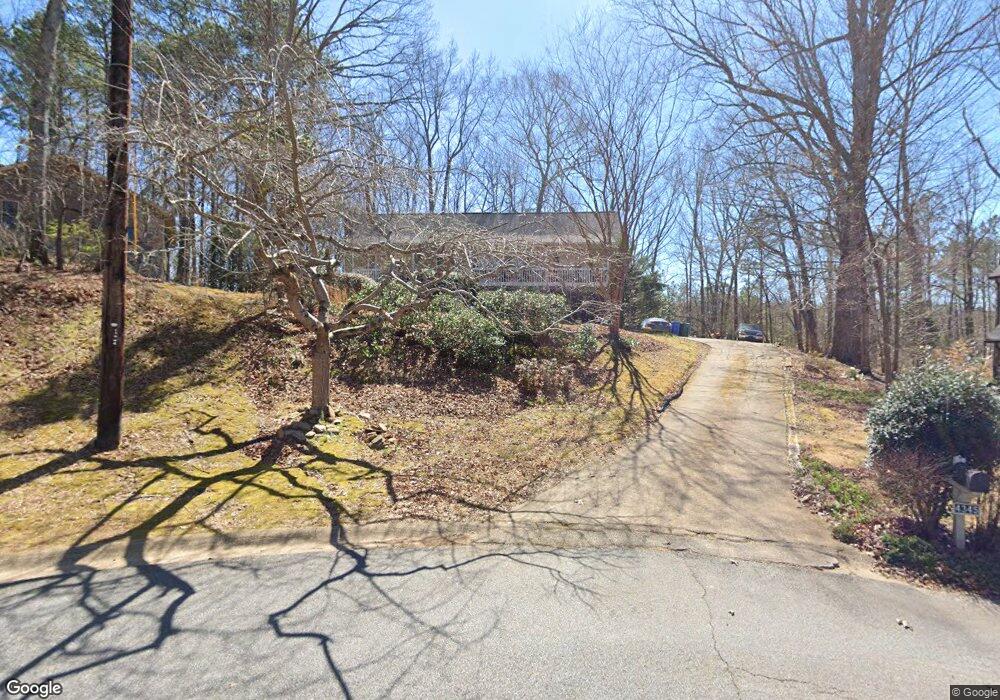
4345 Fawn Ln SE Smyrna, GA 30082
Estimated Value: $435,000 - $459,000
4
Beds
3
Baths
1,692
Sq Ft
$264/Sq Ft
Est. Value
About This Home
This home is located at 4345 Fawn Ln SE, Smyrna, GA 30082 and is currently estimated at $446,847, approximately $264 per square foot. 4345 Fawn Ln SE is a home located in Cobb County with nearby schools including King Springs Elementary School, Griffin Middle School, and Campbell High School.
Ownership History
Date
Name
Owned For
Owner Type
Purchase Details
Closed on
Dec 29, 2010
Sold by
Lge Cmnty Cu
Bought by
Heisner James H
Current Estimated Value
Home Financials for this Owner
Home Financials are based on the most recent Mortgage that was taken out on this home.
Original Mortgage
$124,755
Outstanding Balance
$83,050
Interest Rate
4.37%
Mortgage Type
FHA
Estimated Equity
$363,797
Purchase Details
Closed on
May 7, 2010
Sold by
Fetter Diane P
Bought by
Lge Cmnty Cu
Purchase Details
Closed on
Nov 19, 2004
Sold by
Laughlin Patrick O
Bought by
Fetter Diane P
Home Financials for this Owner
Home Financials are based on the most recent Mortgage that was taken out on this home.
Original Mortgage
$207,500
Interest Rate
5.66%
Mortgage Type
New Conventional
Purchase Details
Closed on
Nov 19, 2001
Sold by
Powell Ann L
Bought by
Owen Patrick
Home Financials for this Owner
Home Financials are based on the most recent Mortgage that was taken out on this home.
Original Mortgage
$153,000
Interest Rate
6.6%
Mortgage Type
New Conventional
Create a Home Valuation Report for This Property
The Home Valuation Report is an in-depth analysis detailing your home's value as well as a comparison with similar homes in the area
Home Values in the Area
Average Home Value in this Area
Purchase History
| Date | Buyer | Sale Price | Title Company |
|---|---|---|---|
| Heisner James H | $128,000 | -- | |
| Lge Cmnty Cu | -- | -- | |
| Fetter Diane P | $227,500 | -- | |
| Owen Patrick | $170,000 | -- |
Source: Public Records
Mortgage History
| Date | Status | Borrower | Loan Amount |
|---|---|---|---|
| Open | Heisner James H | $124,755 | |
| Previous Owner | Fetter Diane P | $207,500 | |
| Previous Owner | Owen Patrick | $153,000 |
Source: Public Records
Tax History Compared to Growth
Tax History
| Year | Tax Paid | Tax Assessment Tax Assessment Total Assessment is a certain percentage of the fair market value that is determined by local assessors to be the total taxable value of land and additions on the property. | Land | Improvement |
|---|---|---|---|---|
| 2025 | $3,404 | $161,904 | $48,000 | $113,904 |
| 2024 | $3,404 | $161,904 | $48,000 | $113,904 |
| 2023 | $2,915 | $161,904 | $48,000 | $113,904 |
| 2022 | $3,539 | $144,600 | $22,000 | $122,600 |
| 2021 | $2,857 | $113,432 | $22,000 | $91,432 |
| 2020 | $2,661 | $104,480 | $22,000 | $82,480 |
| 2019 | $2,661 | $104,480 | $22,000 | $82,480 |
| 2018 | $2,621 | $102,640 | $18,000 | $84,640 |
| 2017 | $2,025 | $80,244 | $18,000 | $62,244 |
| 2016 | $2,027 | $80,244 | $18,000 | $62,244 |
| 2015 | $1,735 | $67,740 | $18,000 | $49,740 |
| 2014 | $1,750 | $67,740 | $0 | $0 |
Source: Public Records
Map
Nearby Homes
- 4025 Benell Ct SE
- 5020 Hickory Mill Dr SE
- 4246 Antler Trail SE
- 4195 Antler Trail SE
- 4135 Fawn Ln SE
- 51 Queen Anne Dr SE
- 1375 Mosswood Ln SE
- 3910 W Cooper Lake Dr SE
- 362 Doeskin Ln SE
- 35 Dunaire Ct SW
- 465 Willowbrook Dr SE
- 0 East-West Connector Unit 11589710
- 418 Mockingbird Ln SE
- 0 Nickajack Rd SE Unit 7594642
- 188 Covered Bridge Trail SW
- 203 Angla Dr SE
- 524 Tackett Farms Rd
- 4724 Warrior Way SE Unit II
- 3808 Concord Approach Way SE
- 4343 Fawn Ln SE Unit 3
- 4347 Fawn Ln SE
- 4341 Fawn Ln SE
- 4344 Fawn Ln SE
- 4331 Fawn Ln SE
- 4342 Fawn Ln SE
- 4340 Fawn Ln SE
- 4328 Fawn Ln SE
- 4323 Fawn Ln SE
- 4319 Fawn Ln SE
- 4030 Benell Ct SE
- 4316 Fawn Ln SE
- 4092 Norton Place SE
- 4031 Benell Ct SE
- 4029 Benell Ct SE
- 4304 Fawn Ln SE
- 4311 Fawn Ln SE
- 4026 Benell Ct SE
- 4090 Norton Place SE
- 4085 Norton Place SE