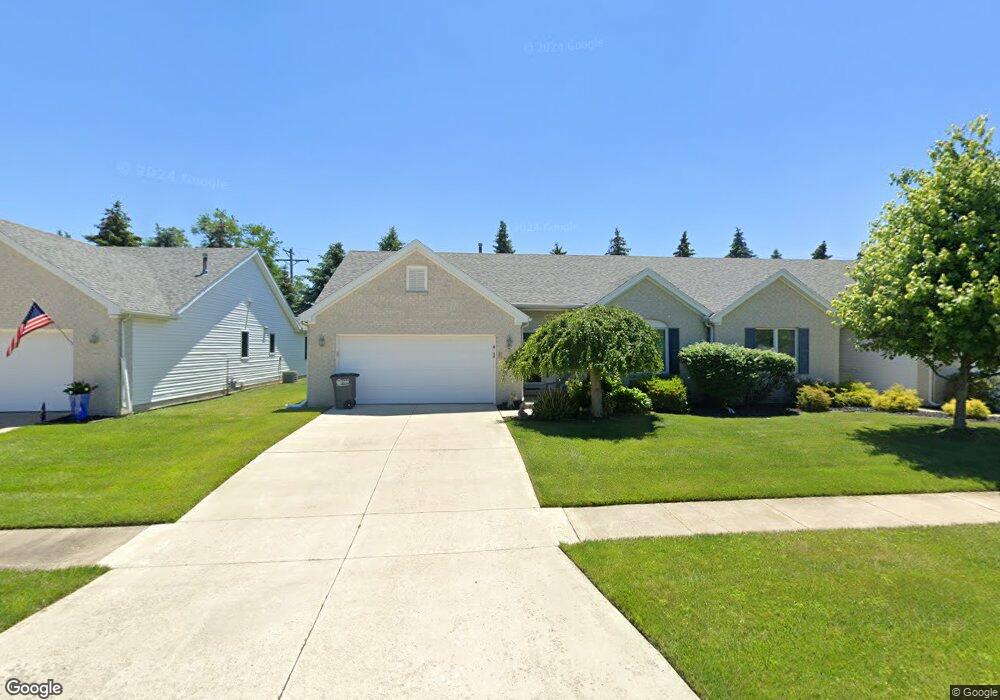
4347 S Watercrest Dr Toledo, OH 43614
Southwyck NeighborhoodEstimated Value: $219,543 - $246,000
3
Beds
2
Baths
1,340
Sq Ft
$173/Sq Ft
Est. Value
About This Home
This home is located at 4347 S Watercrest Dr, Toledo, OH 43614 and is currently estimated at $231,386, approximately $172 per square foot. 4347 S Watercrest Dr is a home located in Lucas County with nearby schools including Glendale-Feilbach Elementary School, Bowsher High School, and Northwest Ohio Classical Academy.
Ownership History
Date
Name
Owned For
Owner Type
Purchase Details
Closed on
Nov 4, 1999
Sold by
Holben Douglas R
Bought by
Holben Adrienne B
Current Estimated Value
Home Financials for this Owner
Home Financials are based on the most recent Mortgage that was taken out on this home.
Original Mortgage
$35,000
Outstanding Balance
$10,277
Interest Rate
7.25%
Estimated Equity
$221,109
Purchase Details
Closed on
Nov 1, 1999
Sold by
Cremean Christine M
Bought by
Holben Adrienne B
Home Financials for this Owner
Home Financials are based on the most recent Mortgage that was taken out on this home.
Original Mortgage
$35,000
Outstanding Balance
$10,277
Interest Rate
7.25%
Estimated Equity
$221,109
Purchase Details
Closed on
Aug 17, 1999
Sold by
Estate Of Phyllis M Abdo
Bought by
Cremean Christine M and Holben Douglas R
Purchase Details
Closed on
May 12, 1998
Sold by
Mccarthy Builders Inc
Bought by
Abdo Phyllis M
Create a Home Valuation Report for This Property
The Home Valuation Report is an in-depth analysis detailing your home's value as well as a comparison with similar homes in the area
Home Values in the Area
Average Home Value in this Area
Purchase History
| Date | Buyer | Sale Price | Title Company |
|---|---|---|---|
| Holben Adrienne B | $46,900 | -- | |
| Holben Adrienne B | $46,900 | -- | |
| Cremean Christine M | -- | American 1St | |
| Abdo Phyllis M | $24,900 | Louisville Title Agency For |
Source: Public Records
Mortgage History
| Date | Status | Borrower | Loan Amount |
|---|---|---|---|
| Open | Holben Adrienne B | $35,000 |
Source: Public Records
Tax History Compared to Growth
Tax History
| Year | Tax Paid | Tax Assessment Tax Assessment Total Assessment is a certain percentage of the fair market value that is determined by local assessors to be the total taxable value of land and additions on the property. | Land | Improvement |
|---|---|---|---|---|
| 2024 | $1,582 | $52,325 | $6,755 | $45,570 |
| 2023 | $2,769 | $43,785 | $5,250 | $38,535 |
| 2022 | $2,764 | $43,785 | $5,250 | $38,535 |
| 2021 | $2,834 | $43,785 | $5,250 | $38,535 |
| 2020 | $2,994 | $41,195 | $9,345 | $31,850 |
| 2019 | $2,925 | $41,195 | $9,345 | $31,850 |
| 2018 | $2,940 | $41,195 | $9,345 | $31,850 |
| 2017 | $3,010 | $40,250 | $9,135 | $31,115 |
| 2016 | $2,988 | $115,000 | $26,100 | $88,900 |
| 2015 | $2,957 | $115,000 | $26,100 | $88,900 |
| 2014 | $2,532 | $40,260 | $9,140 | $31,120 |
| 2013 | $2,532 | $40,260 | $9,140 | $31,120 |
Source: Public Records
Map
Nearby Homes
- 4534 Heathercove Place
- 2451 Eastgate Rd
- 4796 Ryan Ridge Place
- 2017 Green Valley Dr
- 4237 Brogan Dr
- 2158 Laurel Valley Dr
- 1933 Woodlore Dr
- 2566 Green Valley Dr
- 4501 Thackeray Rd
- 2020 W Crest Dr
- 2155 Bishopsgate Dr
- 652 Mcintyre Ln
- 1553 Heather Meadow Dr
- 1733 Parkway Dr N
- 3770 Heatherdowns Blvd
- 1969 Oaklawn Dr
- 1736 Parkway Dr N
- 1725 Parkway Dr S
- 3950 Grandview Ct
- 1466 Wilderness Dr
- 4353 S Watercrest Dr
- 4343 S Watercrest Dr
- 4357 S Watercrest Dr
- 4337 S Watercrest Dr
- 4516 Heathercove Place
- 4344 S Watercrest Dr
- 4522 Heathercove Place
- 4363 S Watercrest Dr
- 4333 S Watercrest Dr
- 4348 S Watercrest Dr
- 4335 S Watercrest Dr
- 4354 S Watercrest Dr
- 4528 Heathercove Place
- 4356 S Watercrest Dr
- 4327 S Watercrest Dr
- 4336 S Watercrest Dr
- 4366 S Watercrest Dr
- 4371 S Watercrest Dr
- 4330 S Watercrest Dr
- 4323 S Watercrest Dr