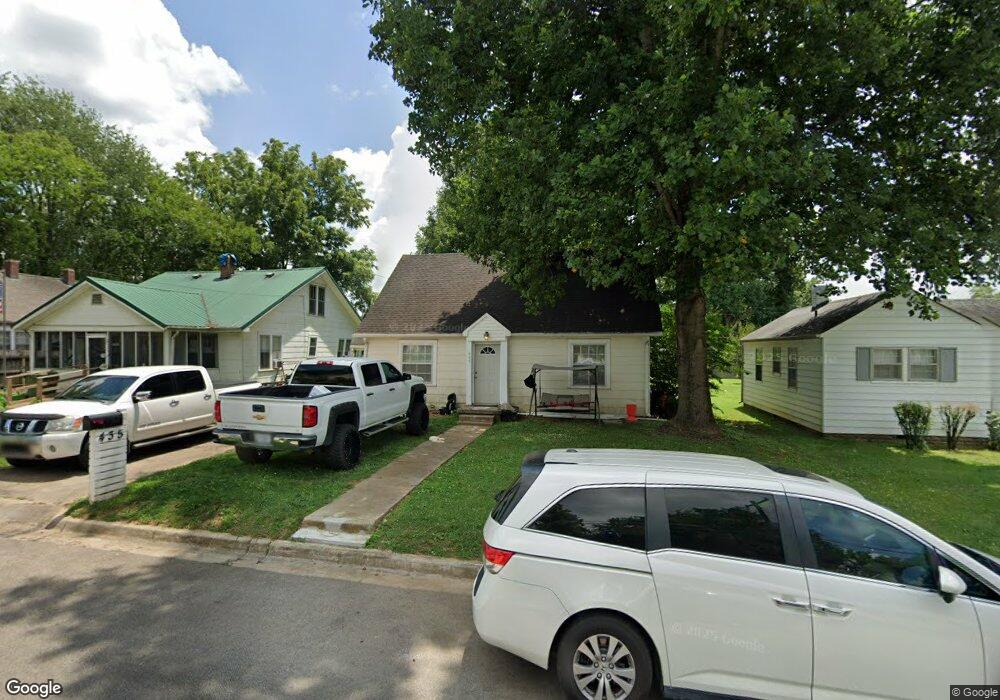
435 1st St Lawrenceburg, TN 38464
Estimated Value: $96,000 - $189,000
--
Bed
1
Bath
1,310
Sq Ft
$114/Sq Ft
Est. Value
About This Home
This home is located at 435 1st St, Lawrenceburg, TN 38464 and is currently estimated at $149,036, approximately $113 per square foot. 435 1st St is a home located in Lawrence County with nearby schools including Ingram Sowell Elementary School, Lawrenceburg Public Elementary School, and David Crockett Elementary School.
Ownership History
Date
Name
Owned For
Owner Type
Purchase Details
Closed on
Apr 3, 2009
Sold by
Lawrenceburg Federal Bank
Bought by
Potts Terry
Current Estimated Value
Home Financials for this Owner
Home Financials are based on the most recent Mortgage that was taken out on this home.
Original Mortgage
$45,000
Outstanding Balance
$21,921
Interest Rate
5.18%
Estimated Equity
$127,115
Purchase Details
Closed on
Dec 8, 2008
Sold by
Kidd Katrina L
Bought by
Lawrenceburg Federal Bank
Purchase Details
Closed on
Sep 25, 1998
Bought by
Kidd Katrina Leann
Purchase Details
Closed on
Dec 5, 1996
Sold by
Shay Randall B
Bought by
Patterson Charles E and Patterson Mabe
Purchase Details
Closed on
Aug 12, 1988
Bought by
Shay Randall B
Purchase Details
Closed on
May 26, 1986
Create a Home Valuation Report for This Property
The Home Valuation Report is an in-depth analysis detailing your home's value as well as a comparison with similar homes in the area
Home Values in the Area
Average Home Value in this Area
Purchase History
| Date | Buyer | Sale Price | Title Company |
|---|---|---|---|
| Potts Terry | $35,000 | -- | |
| Lawrenceburg Federal Bank | $47,302 | -- | |
| Kidd Katrina Leann | $46,000 | -- | |
| Patterson Charles E | $30,000 | -- | |
| Shay Randall B | -- | -- | |
| -- | $23,100 | -- |
Source: Public Records
Mortgage History
| Date | Status | Borrower | Loan Amount |
|---|---|---|---|
| Open | Not Available | $45,000 |
Source: Public Records
Tax History Compared to Growth
Tax History
| Year | Tax Paid | Tax Assessment Tax Assessment Total Assessment is a certain percentage of the fair market value that is determined by local assessors to be the total taxable value of land and additions on the property. | Land | Improvement |
|---|---|---|---|---|
| 2025 | $693 | $22,300 | $0 | $0 |
| 2024 | $693 | $22,300 | $1,500 | $20,800 |
| 2023 | $693 | $22,300 | $1,500 | $20,800 |
| 2022 | $693 | $22,300 | $1,500 | $20,800 |
| 2021 | $489 | $11,125 | $1,500 | $9,625 |
| 2020 | $489 | $11,125 | $1,500 | $9,625 |
| 2019 | $489 | $11,125 | $1,500 | $9,625 |
| 2018 | $489 | $11,125 | $1,500 | $9,625 |
| 2017 | $489 | $11,125 | $1,500 | $9,625 |
| 2016 | $489 | $11,125 | $1,500 | $9,625 |
| 2015 | $463 | $11,125 | $1,500 | $9,625 |
| 2014 | $457 | $10,975 | $1,500 | $9,475 |
Source: Public Records
Map
Nearby Homes