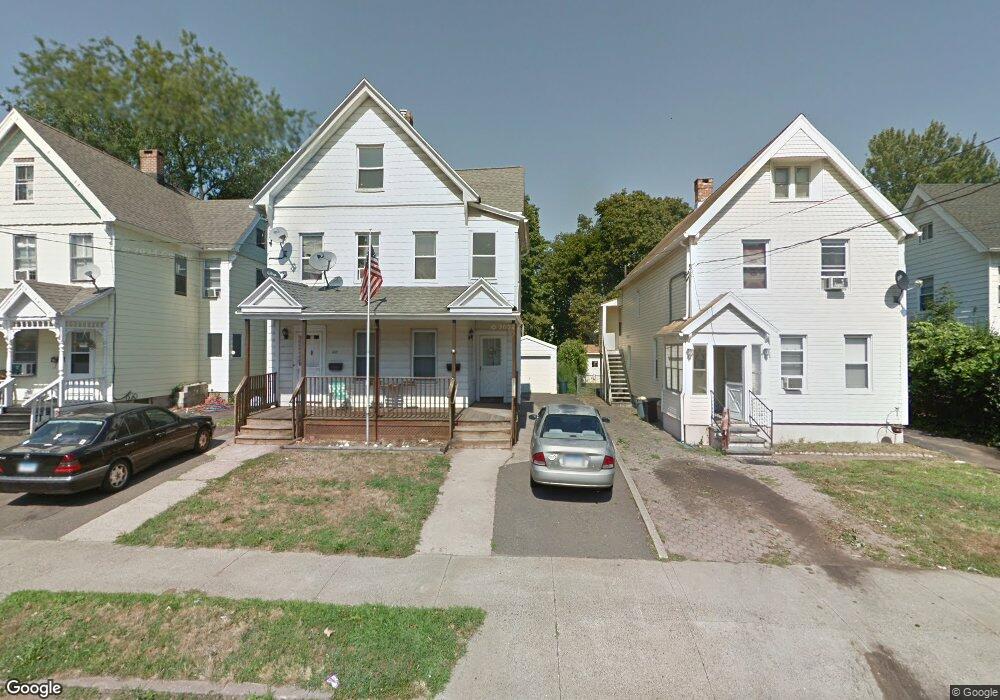
435 3rd Ave West Haven, CT 06516
West Haven Center NeighborhoodEstimated Value: $275,000 - $423,000
4
Beds
2
Baths
2,004
Sq Ft
$180/Sq Ft
Est. Value
About This Home
This home is located at 435 3rd Ave, West Haven, CT 06516 and is currently estimated at $359,938, approximately $179 per square foot. 435 3rd Ave is a home located in New Haven County with nearby schools including Carrigan 5/6 Intermediate School, Harry M. Bailey Middle School, and West Haven High School.
Ownership History
Date
Name
Owned For
Owner Type
Purchase Details
Closed on
Jan 24, 2024
Sold by
Roeck Werner and Roeck Elizabeth
Bought by
435 Third Llc
Current Estimated Value
Home Financials for this Owner
Home Financials are based on the most recent Mortgage that was taken out on this home.
Original Mortgage
$234,600
Outstanding Balance
$230,224
Interest Rate
6.61%
Mortgage Type
Commercial
Estimated Equity
$129,714
Create a Home Valuation Report for This Property
The Home Valuation Report is an in-depth analysis detailing your home's value as well as a comparison with similar homes in the area
Home Values in the Area
Average Home Value in this Area
Purchase History
| Date | Buyer | Sale Price | Title Company |
|---|---|---|---|
| 435 Third Llc | $220,000 | None Available | |
| 435 Third Llc | $220,000 | None Available |
Source: Public Records
Mortgage History
| Date | Status | Borrower | Loan Amount |
|---|---|---|---|
| Open | 435 Third Llc | $234,600 | |
| Closed | 435 Third Llc | $234,600 |
Source: Public Records
Tax History
| Year | Tax Paid | Tax Assessment Tax Assessment Total Assessment is a certain percentage of the fair market value that is determined by local assessors to be the total taxable value of land and additions on the property. | Land | Improvement |
|---|---|---|---|---|
| 2025 | $7,814 | $226,310 | $59,570 | $166,740 |
| 2024 | $7,170 | $147,770 | $41,230 | $106,540 |
| 2023 | $6,873 | $147,770 | $41,230 | $106,540 |
| 2022 | $6,738 | $147,770 | $41,230 | $106,540 |
| 2021 | $6,738 | $147,770 | $41,230 | $106,540 |
| 2020 | $5,985 | $118,580 | $33,180 | $85,400 |
| 2019 | $5,771 | $118,580 | $33,180 | $85,400 |
| 2018 | $5,721 | $118,580 | $33,180 | $85,400 |
| 2017 | $5,414 | $118,580 | $33,180 | $85,400 |
| 2016 | $5,403 | $118,580 | $33,180 | $85,400 |
| 2015 | $5,367 | $133,000 | $36,960 | $96,040 |
| 2014 | $5,333 | $133,000 | $36,960 | $96,040 |
Source: Public Records
Map
Nearby Homes
Your Personal Tour Guide
Ask me questions while you tour the home.