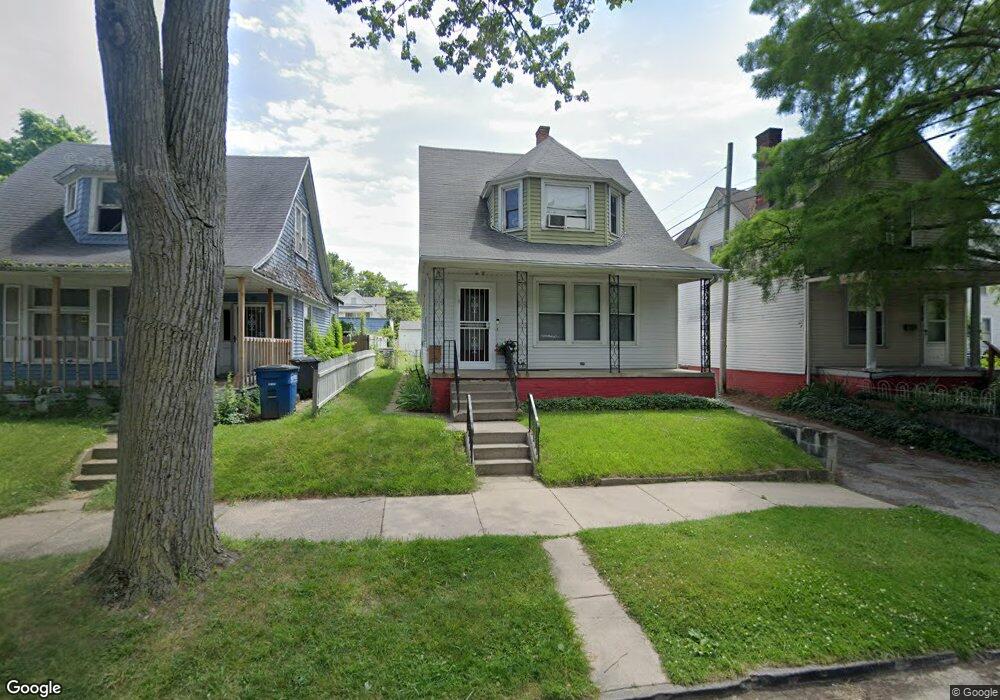
435 Chapin St Toledo, OH 43609
Southside NeighborhoodEstimated Value: $43,000 - $74,000
4
Beds
1
Bath
1,505
Sq Ft
$41/Sq Ft
Est. Value
About This Home
This home is located at 435 Chapin St, Toledo, OH 43609 and is currently estimated at $61,965, approximately $41 per square foot. 435 Chapin St is a home located in Lucas County with nearby schools including Marshall Stemm Academy, Jesup W. Scott High School, and Summit Academy - Toledo.
Ownership History
Date
Name
Owned For
Owner Type
Purchase Details
Closed on
Jun 1, 1994
Sold by
Shinaver Marsha A
Bought by
Roesch Robert T and Roesch Gloria G
Current Estimated Value
Home Financials for this Owner
Home Financials are based on the most recent Mortgage that was taken out on this home.
Original Mortgage
$29,500
Interest Rate
8.48%
Mortgage Type
New Conventional
Purchase Details
Closed on
Feb 17, 1993
Sold by
Shinavar Kenneth L
Purchase Details
Closed on
Jun 19, 1989
Sold by
Boellner Josephine
Create a Home Valuation Report for This Property
The Home Valuation Report is an in-depth analysis detailing your home's value as well as a comparison with similar homes in the area
Home Values in the Area
Average Home Value in this Area
Purchase History
| Date | Buyer | Sale Price | Title Company |
|---|---|---|---|
| Roesch Robert T | $28,500 | -- | |
| -- | -- | -- | |
| -- | $24,000 | -- |
Source: Public Records
Mortgage History
| Date | Status | Borrower | Loan Amount |
|---|---|---|---|
| Closed | Roesch Robert T | $29,500 |
Source: Public Records
Tax History Compared to Growth
Tax History
| Year | Tax Paid | Tax Assessment Tax Assessment Total Assessment is a certain percentage of the fair market value that is determined by local assessors to be the total taxable value of land and additions on the property. | Land | Improvement |
|---|---|---|---|---|
| 2024 | $444 | $12,075 | $1,715 | $10,360 |
| 2023 | $697 | $8,470 | $1,400 | $7,070 |
| 2022 | $710 | $8,470 | $1,400 | $7,070 |
| 2021 | $705 | $8,470 | $1,400 | $7,070 |
| 2020 | $722 | $7,945 | $1,365 | $6,580 |
| 2019 | $735 | $7,945 | $1,365 | $6,580 |
| 2018 | $667 | $7,945 | $1,365 | $6,580 |
| 2017 | $1,095 | $7,140 | $1,365 | $5,775 |
| 2016 | $684 | $20,400 | $3,900 | $16,500 |
| 2015 | $666 | $20,400 | $3,900 | $16,500 |
| 2014 | $450 | $7,150 | $1,370 | $5,780 |
| 2013 | $450 | $7,150 | $1,370 | $5,780 |
Source: Public Records
Map
Nearby Homes
- 428 Havre St
- 325 Chapin St
- 714 Walbridge Ave
- 511 Congress St
- 323 Langdon St
- 872 Prouty Ave
- 641 South Ave
- 816 Orchard St
- 702 Boalt St
- 620 South Ave
- 925 Colburn St
- 616 Thayer St
- 713 Orchard St
- 642 Orchard St
- 765 Redwood Ave
- 708 Bowman St
- 930 Orchard St
- 763 Redwood Ave
- 936 Orchard St
- 616 Pleasant Place