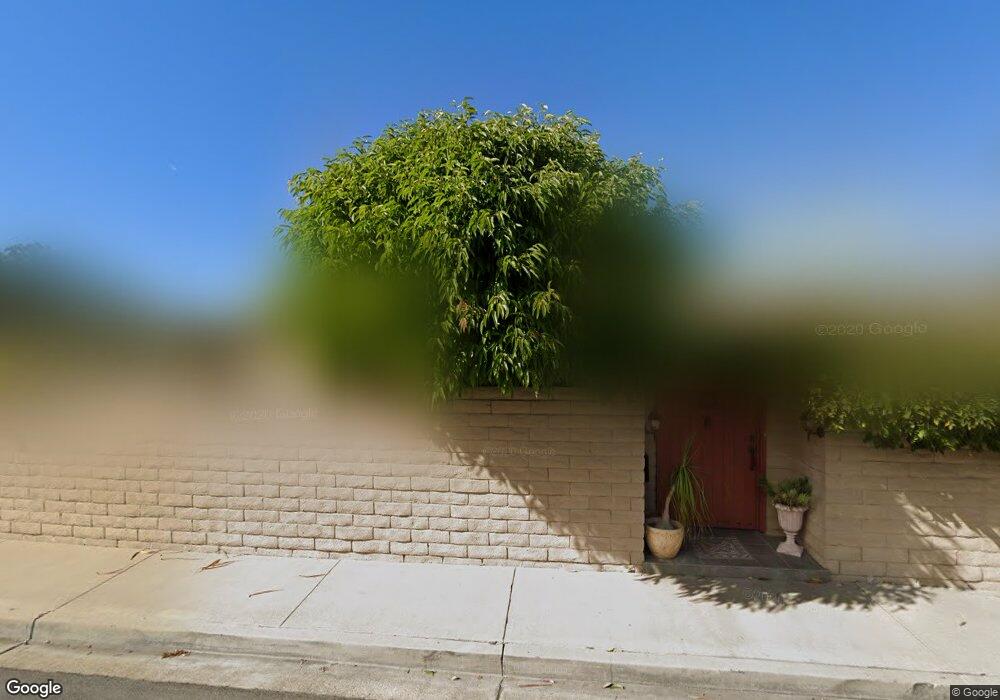
435 Clipper Way Seal Beach, CA 90740
Estimated Value: $1,576,673 - $1,714,000
2
Beds
2
Baths
1,431
Sq Ft
$1,160/Sq Ft
Est. Value
About This Home
This home is located at 435 Clipper Way, Seal Beach, CA 90740 and is currently estimated at $1,659,418, approximately $1,159 per square foot. 435 Clipper Way is a home located in Orange County with nearby schools including J. H. Mcgaugh Elementary School, Jack L. Weaver Elementary School, and Sharon Christa Mcauliffe Middle School.
Ownership History
Date
Name
Owned For
Owner Type
Purchase Details
Closed on
Feb 28, 2019
Sold by
Reynolds Ginger L
Bought by
Boyd Shawn R and Boyd Kimberly L
Current Estimated Value
Home Financials for this Owner
Home Financials are based on the most recent Mortgage that was taken out on this home.
Original Mortgage
$600,000
Outstanding Balance
$526,428
Interest Rate
4.3%
Mortgage Type
New Conventional
Estimated Equity
$1,132,990
Purchase Details
Closed on
Jul 19, 2016
Sold by
Reynolds Ginger L
Bought by
Reynolds Ginger L
Purchase Details
Closed on
Jun 30, 1999
Sold by
Joanne Bishop
Bought by
Reynolds Gloria L and Reynolds Family Trust
Purchase Details
Closed on
Sep 20, 1996
Sold by
Bishop Jack E
Bought by
Bishop Jo Anne Catherine
Create a Home Valuation Report for This Property
The Home Valuation Report is an in-depth analysis detailing your home's value as well as a comparison with similar homes in the area
Home Values in the Area
Average Home Value in this Area
Purchase History
| Date | Buyer | Sale Price | Title Company |
|---|---|---|---|
| Boyd Shawn R | $1,050,000 | Lawyers Title Company | |
| Reynolds Ginger L | -- | None Available | |
| Reynolds Gloria L | $425,000 | First American Title Ins Co | |
| Bishop Jo Anne Catherine | -- | -- |
Source: Public Records
Mortgage History
| Date | Status | Borrower | Loan Amount |
|---|---|---|---|
| Open | Boyd Shawn R | $600,000 |
Source: Public Records
Tax History Compared to Growth
Tax History
| Year | Tax Paid | Tax Assessment Tax Assessment Total Assessment is a certain percentage of the fair market value that is determined by local assessors to be the total taxable value of land and additions on the property. | Land | Improvement |
|---|---|---|---|---|
| 2025 | $13,362 | $1,171,292 | $1,041,846 | $129,446 |
| 2024 | $13,362 | $1,148,326 | $1,021,418 | $126,908 |
| 2023 | $13,066 | $1,125,810 | $1,001,390 | $124,420 |
| 2022 | $12,935 | $1,103,736 | $981,755 | $121,981 |
| 2021 | $12,647 | $1,082,095 | $962,505 | $119,590 |
| 2020 | $12,670 | $1,071,000 | $952,636 | $118,364 |
| 2019 | $7,103 | $585,568 | $469,225 | $116,343 |
| 2018 | $6,782 | $574,087 | $460,025 | $114,062 |
| 2017 | $6,639 | $562,831 | $451,005 | $111,826 |
| 2016 | $6,437 | $551,796 | $442,162 | $109,634 |
| 2015 | $6,353 | $543,508 | $435,520 | $107,988 |
| 2014 | $6,198 | $532,862 | $426,989 | $105,873 |
Source: Public Records
Map
Nearby Homes
- 400 Electric Ave
- 390 Electric Ave
- 440 Electric Ave
- 380 Electric Ave
- 395 Clipper Way
- 368 Galleon Way
- 430 Clipper Way
- 370 Electric Ave
- 385 Clipper Way
- 420 Clipper Way
- 460 Electric Ave
- 376 Galleon Way
- 369 Galleon Way
- 360 Electric Ave
- 410 Clipper Way
- 375 Clipper Way
- 377 Galleon Way
- 384 Galleon Way
- 400 Clipper Way
- 350 Electric Ave