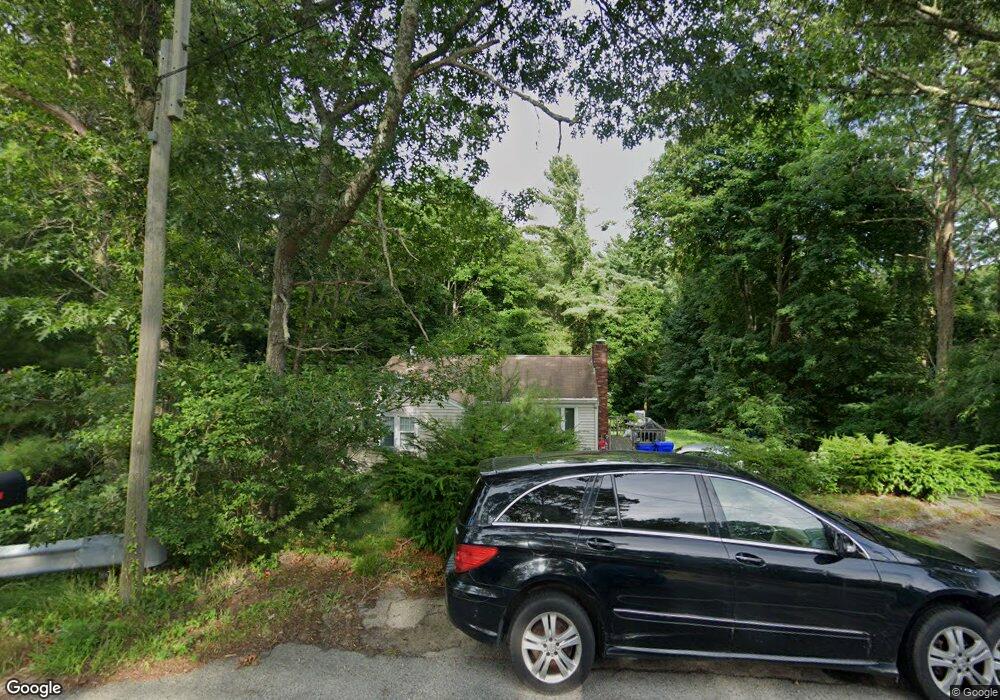
435 County Rd Pocasset, MA 02559
Monument Beach NeighborhoodEstimated Value: $502,039 - $605,000
3
Beds
1
Bath
992
Sq Ft
$537/Sq Ft
Est. Value
About This Home
This home is located at 435 County Rd, Pocasset, MA 02559 and is currently estimated at $532,260, approximately $536 per square foot. 435 County Rd is a home located in Barnstable County with nearby schools including Bourne High School, St Margaret Regional School, and Cadence Academy Preschool - Bourne.
Ownership History
Date
Name
Owned For
Owner Type
Purchase Details
Closed on
Mar 8, 2020
Sold by
Marshall Julia A
Bought by
Julia A Marshall T A and Julia Marshall
Current Estimated Value
Purchase Details
Closed on
Mar 22, 2019
Sold by
Marshall Robert W and Marshall Julia A
Bought by
Marshall Julia A
Purchase Details
Closed on
Nov 30, 2018
Sold by
Marshall Robert H and Marshall Julia A
Bought by
Marshall Robert W
Create a Home Valuation Report for This Property
The Home Valuation Report is an in-depth analysis detailing your home's value as well as a comparison with similar homes in the area
Home Values in the Area
Average Home Value in this Area
Purchase History
| Date | Buyer | Sale Price | Title Company |
|---|---|---|---|
| Julia A Marshall T A | -- | None Available | |
| Julia A Marshall T A | -- | None Available | |
| Marshall Julia A | -- | -- | |
| Marshall Julia A | -- | -- | |
| Marshall Robert W | -- | -- | |
| Marshall Robert W | -- | -- | |
| Marshall Robert W | -- | -- | |
| Marshall Robert W | -- | -- |
Source: Public Records
Tax History
| Year | Tax Paid | Tax Assessment Tax Assessment Total Assessment is a certain percentage of the fair market value that is determined by local assessors to be the total taxable value of land and additions on the property. | Land | Improvement |
|---|---|---|---|---|
| 2025 | $3,050 | $390,500 | $194,100 | $196,400 |
| 2024 | $3,064 | $382,100 | $195,100 | $187,000 |
| 2023 | $2,980 | $338,200 | $172,700 | $165,500 |
| 2022 | $2,885 | $285,900 | $152,800 | $133,100 |
| 2021 | $2,803 | $260,300 | $139,100 | $121,200 |
| 2020 | $2,713 | $252,600 | $137,800 | $114,800 |
| 2019 | $2,587 | $246,100 | $137,800 | $108,300 |
| 2018 | $2,269 | $215,300 | $117,400 | $97,900 |
| 2017 | $2,157 | $209,400 | $116,300 | $93,100 |
| 2016 | $1,923 | $189,300 | $109,500 | $79,800 |
| 2015 | $1,906 | $189,300 | $109,500 | $79,800 |
Source: Public Records
Map
Nearby Homes
- 10 Howard Ave
- 10 Howard Ave
- 566 Shore Rd
- 203 County Rd
- 20 Colony Ave
- 16 Amberwood Ct
- 14 Navajo Rd
- 5 Harbor Hill Dr
- 4 Harbor Hill Dr
- 12 Turnberry Rd Unit 12
- 709 County Rd
- 3 1st St
- 254 Barlows Landing Rd
- 13 Laurel Hill Ct
- 2 Applewood Ct
- 5 Sea Knoll Ct
- 4 Hollyhock Knoll Ct Unit 4
- 4 Hollyhock Knoll Ct Unit 4
- 3 4th Ave
- 7 4th Ave
Your Personal Tour Guide
Ask me questions while you tour the home.