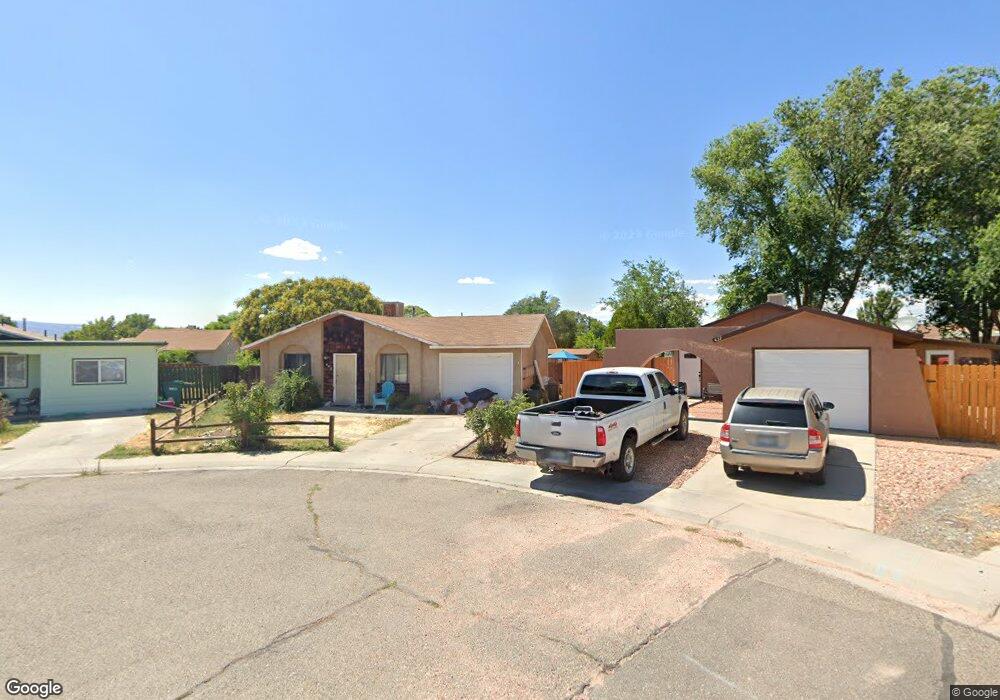
435 Devon Ct Grand Junction, CO 81504
Estimated Value: $267,000 - $290,000
3
Beds
1
Bath
1,000
Sq Ft
$281/Sq Ft
Est. Value
About This Home
This home is located at 435 Devon Ct, Grand Junction, CO 81504 and is currently estimated at $281,441, approximately $281 per square foot. 435 Devon Ct is a home located in Mesa County with nearby schools including Pear Park Elementary School, Grand Mesa Middle School, and Central High School.
Ownership History
Date
Name
Owned For
Owner Type
Purchase Details
Closed on
Aug 15, 2002
Sold by
Ogden Dale Lee and Ogden Amber Leslie
Bought by
Gutierrez John D and Gutierrez Bridgett R
Current Estimated Value
Home Financials for this Owner
Home Financials are based on the most recent Mortgage that was taken out on this home.
Original Mortgage
$92,449
Outstanding Balance
$39,260
Interest Rate
6.6%
Mortgage Type
FHA
Estimated Equity
$242,181
Purchase Details
Closed on
Oct 1, 1999
Sold by
Noller Linda
Bought by
Ogden Dale Lee and Ogden Amber Leslie
Home Financials for this Owner
Home Financials are based on the most recent Mortgage that was taken out on this home.
Original Mortgage
$71,907
Interest Rate
7.83%
Purchase Details
Closed on
Apr 6, 1994
Sold by
Brownson B E
Bought by
Gutierrez John D
Purchase Details
Closed on
Jun 25, 1993
Sold by
Brownson H E
Bought by
Gutierrez John D
Purchase Details
Closed on
Jan 20, 1993
Sold by
Smith Norma Gail
Bought by
Gutierrez John D
Create a Home Valuation Report for This Property
The Home Valuation Report is an in-depth analysis detailing your home's value as well as a comparison with similar homes in the area
Home Values in the Area
Average Home Value in this Area
Purchase History
| Date | Buyer | Sale Price | Title Company |
|---|---|---|---|
| Gutierrez John D | $93,900 | -- | |
| Ogden Dale Lee | $72,500 | First American Title Co | |
| Gutierrez John D | $50,000 | -- | |
| Gutierrez John D | -- | -- | |
| Gutierrez John D | -- | -- |
Source: Public Records
Mortgage History
| Date | Status | Borrower | Loan Amount |
|---|---|---|---|
| Open | Gutierrez John D | $92,449 | |
| Previous Owner | Ogden Dale Lee | $71,907 |
Source: Public Records
Tax History
| Year | Tax Paid | Tax Assessment Tax Assessment Total Assessment is a certain percentage of the fair market value that is determined by local assessors to be the total taxable value of land and additions on the property. | Land | Improvement |
|---|---|---|---|---|
| 2024 | $905 | $12,180 | $2,570 | $9,610 |
| 2023 | $905 | $12,180 | $2,570 | $9,610 |
| 2022 | $866 | $11,430 | $3,130 | $8,300 |
| 2021 | $869 | $11,760 | $3,220 | $8,540 |
| 2020 | $755 | $10,430 | $2,150 | $8,280 |
| 2019 | $716 | $10,430 | $2,150 | $8,280 |
| 2018 | $632 | $8,440 | $1,800 | $6,640 |
| 2016 | $454 | $7,030 | $1,990 | $5,040 |
Source: Public Records
Map
Nearby Homes
- 418 Pear Meadows St
- 412 Pear Meadows St
- 3025 Red Pear Dr
- 3018 Oakwood Dr Unit 3A 3B
- 3019 Oakwood Dr
- 412 1/2 Wedgewood Ave
- 3016 Autumn Glenn
- 408 Bristol Ct
- 3058 Sandpiper Ave
- 417 Allison Way
- 3006 1/2 Oakwood Dr Unit 4A 4B
- 421 Lark Dr
- 3033 Prairie View Dr
- 3060 Thrush Dr
- 454 1/2 Seminole Ct
- 3067 Hummingbird Ct
- 410 1/2 Lark Ct
- 418 Pear Ln
- 425 Alamo St
- 3075 1/2 Meadowvale Way
- 433 Devon Ct
- 437 Devon Ct
- 431 Devon Ct
- 436 Devon Ct
- 431 1/2 Devon Ct
- 428 1/2 Saxon Ct
- 0 Devon Ct
- 432 1/2 Devon Ct
- 0 Saxon Ct
- 3035 Wedgewood Ave
- 430 Saxon Ct
- 0 Wedgewood Ave Unit 598378
- 0 Wedgewood Ave Unit 608404
- 0 Wedgewood Ave Unit 616908
- 0 Wedgewood Ave Unit 620973
- 0 Wedgewood Ave Unit 630004
- 0 Wedgewood Ave Unit 633029
- 0 Wedgewood Ave Unit 641333
- 426 1/2 Saxon Ct
- 3034 Colorado Ave