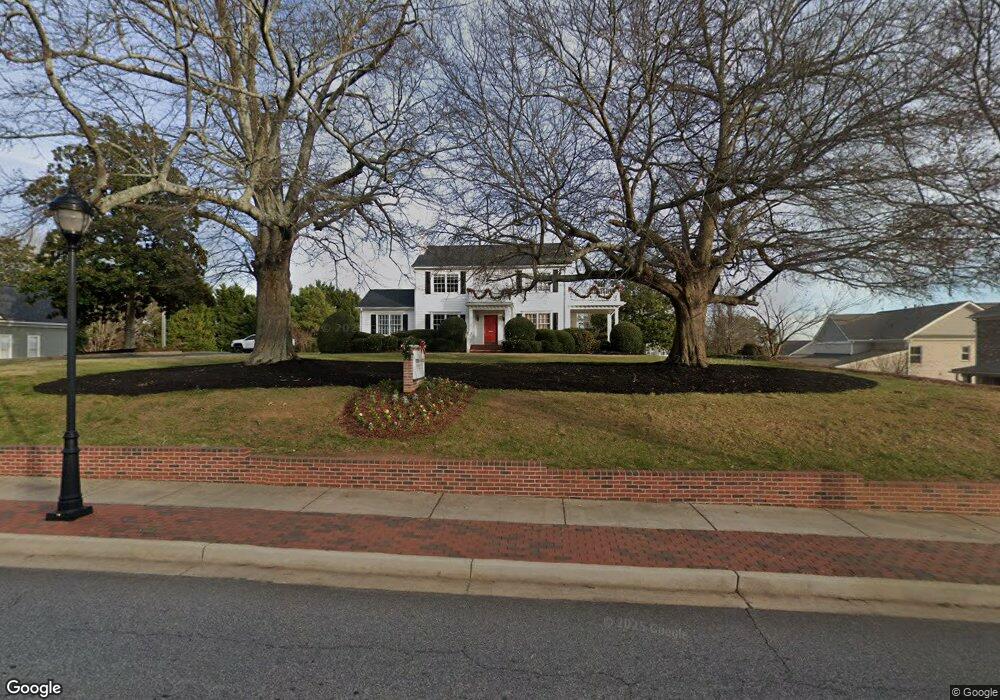
435 E Main St Buford, GA 30518
Estimated Value: $635,000 - $767,865
3
Beds
1
Bath
2,704
Sq Ft
$259/Sq Ft
Est. Value
About This Home
This home is located at 435 E Main St, Buford, GA 30518 and is currently estimated at $701,433, approximately $259 per square foot. 435 E Main St is a home located in Gwinnett County with nearby schools including Buford Elementary School, Buford Senior Academy, and Buford Academy.
Ownership History
Date
Name
Owned For
Owner Type
Purchase Details
Closed on
Aug 14, 2024
Sold by
Todd Walters Real Estate Coaching Inc
Bought by
521 Blue Llc
Current Estimated Value
Home Financials for this Owner
Home Financials are based on the most recent Mortgage that was taken out on this home.
Original Mortgage
$620,000
Outstanding Balance
$376,828
Interest Rate
6.77%
Mortgage Type
New Conventional
Estimated Equity
$324,605
Purchase Details
Closed on
Mar 4, 2016
Sold by
Dean Ann Newton Trustee
Bought by
Todd Walters Real Estate Coaching Llc
Home Financials for this Owner
Home Financials are based on the most recent Mortgage that was taken out on this home.
Original Mortgage
$212,500
Interest Rate
3.72%
Mortgage Type
Commercial
Purchase Details
Closed on
Jun 7, 2007
Sold by
Dean Ann N
Bought by
Borja Alonzo M
Home Financials for this Owner
Home Financials are based on the most recent Mortgage that was taken out on this home.
Original Mortgage
$360,000
Interest Rate
6.16%
Mortgage Type
Commercial
Create a Home Valuation Report for This Property
The Home Valuation Report is an in-depth analysis detailing your home's value as well as a comparison with similar homes in the area
Home Values in the Area
Average Home Value in this Area
Purchase History
| Date | Buyer | Sale Price | Title Company |
|---|---|---|---|
| 521 Blue Llc | $775,000 | -- | |
| Todd Walters Real Estate Coaching Llc | $240,000 | -- | |
| Borja Alonzo M | $400,000 | -- | |
| Dean Ann N | -- | -- |
Source: Public Records
Mortgage History
| Date | Status | Borrower | Loan Amount |
|---|---|---|---|
| Open | 521 Blue Llc | $620,000 | |
| Previous Owner | Todd Walters Real Estate Coaching Llc | $212,500 | |
| Previous Owner | Dean Ann N | $360,000 |
Source: Public Records
Tax History
| Year | Tax Paid | Tax Assessment Tax Assessment Total Assessment is a certain percentage of the fair market value that is determined by local assessors to be the total taxable value of land and additions on the property. | Land | Improvement |
|---|---|---|---|---|
| 2025 | -- | $292,040 | $94,080 | $197,960 |
| 2024 | $2,388 | $166,400 | $56,440 | $109,960 |
| 2023 | $2,388 | $159,600 | $58,320 | $101,280 |
| 2022 | $0 | $142,400 | $43,200 | $99,200 |
| 2021 | $1,592 | $122,840 | $94,080 | $28,760 |
| 2020 | $1,592 | $122,840 | $94,080 | $28,760 |
| 2019 | $1,592 | $122,840 | $94,080 | $28,760 |
| 2018 | $871 | $67,200 | $47,040 | $20,160 |
| 2016 | $861 | $67,200 | $47,040 | $20,160 |
| 2015 | $892 | $67,200 | $47,040 | $20,160 |
| 2014 | $907 | $67,200 | $47,040 | $20,160 |
Source: Public Records
Map
Nearby Homes
- 48 Stonehedge Ct
- 300 Forest St
- 550 Gwinnett St
- 120 N Gwinnett St
- 0 E Moreno St
- 575 Forest St
- 7307 William St
- 1049 Caruso Dr
- 1098 Caruso Dr
- 2258 Seed Way
- 449 S Hill St
- 2020 Harvester Ln
- 570 Power Ave
- 185 Scott St
- 151 N Church St
- 460 Espy St
- 76 W Moreno St
- 5450 N Richland Creek Rd
- 585 Briard Dr
- 1769 Rowland Pass
- 445 E Main St Unit 445
- 445 E Main St
- 2416 Taft St
- 455 E Main St
- 455 Sawnee Ave
- 2426 Taft St
- 476 E Shadburn Ave Unit A
- 476 E Shadburn Ave Unit A
- 476 E Shadburn Ave Unit D
- 476 E Shadburn Ave Unit B
- 476 E Shadburn Ave
- 2427 Taft St
- 465 E Main St
- 5122 Greenard Watson Ln
- 2417 Taft St
- 5112 Greenard Watson Ln
- 486 E Shadburn Ave
- 476 W Shadburn Ave
- 476 W Shadburn Ave Unit A-D
- 476 W Shadburn Ave Unit B
Your Personal Tour Guide
Ask me questions while you tour the home.