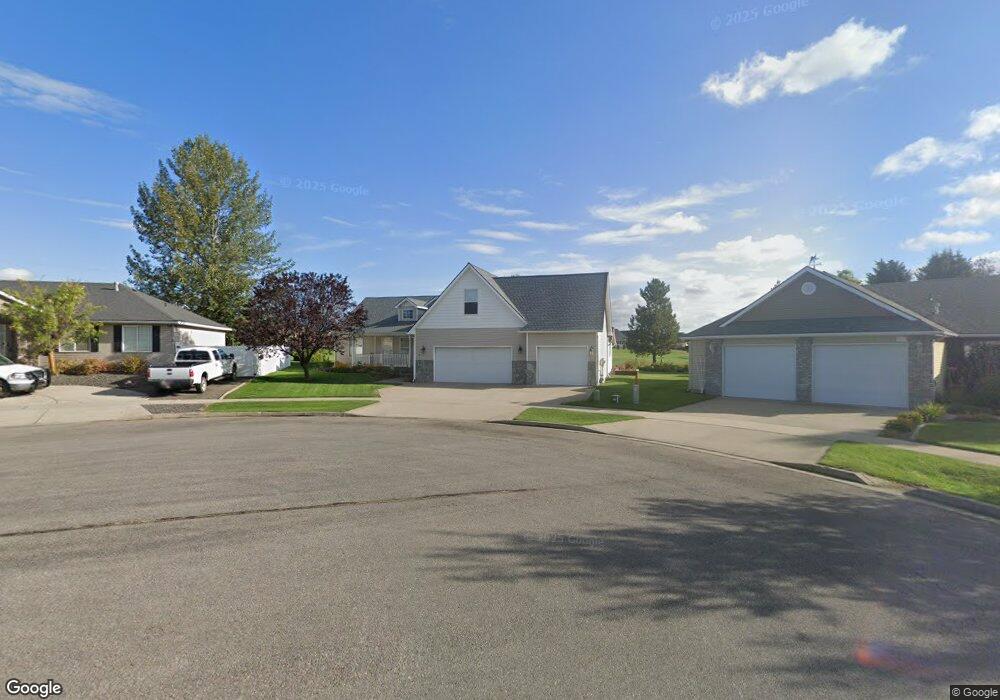
435 E Titanium Ct Post Falls, ID 83854
North Prairie NeighborhoodEstimated Value: $563,000 - $596,146
3
Beds
2
Baths
2,214
Sq Ft
$262/Sq Ft
Est. Value
About This Home
This home is located at 435 E Titanium Ct, Post Falls, ID 83854 and is currently estimated at $579,287, approximately $261 per square foot. 435 E Titanium Ct is a home located in Kootenai County with nearby schools including Mullan Trail Elementary School, Post Falls Middle School, and Post Falls High School.
Ownership History
Date
Name
Owned For
Owner Type
Purchase Details
Closed on
Dec 26, 2014
Sold by
Neustel Conrad W and Neustel Zala B
Bought by
Henke Thomas R and Henke Nancy L
Current Estimated Value
Home Financials for this Owner
Home Financials are based on the most recent Mortgage that was taken out on this home.
Original Mortgage
$200,000
Outstanding Balance
$153,424
Interest Rate
3.96%
Mortgage Type
New Conventional
Estimated Equity
$425,863
Create a Home Valuation Report for This Property
The Home Valuation Report is an in-depth analysis detailing your home's value as well as a comparison with similar homes in the area
Home Values in the Area
Average Home Value in this Area
Purchase History
| Date | Buyer | Sale Price | Title Company |
|---|---|---|---|
| Henke Thomas R | -- | Alliance Title |
Source: Public Records
Mortgage History
| Date | Status | Borrower | Loan Amount |
|---|---|---|---|
| Open | Henke Thomas R | $200,000 |
Source: Public Records
Tax History
| Year | Tax Paid | Tax Assessment Tax Assessment Total Assessment is a certain percentage of the fair market value that is determined by local assessors to be the total taxable value of land and additions on the property. | Land | Improvement |
|---|---|---|---|---|
| 2025 | $2,395 | $574,780 | $195,000 | $379,780 |
| 2024 | $2,166 | $515,980 | $152,000 | $363,980 |
| 2023 | $2,166 | $553,099 | $160,000 | $393,099 |
| 2022 | $3,063 | $624,276 | $187,500 | $436,776 |
| 2021 | $2,723 | $394,390 | $125,000 | $269,390 |
| 2020 | $2,795 | $345,170 | $110,000 | $235,170 |
| 2019 | $2,907 | $330,540 | $100,000 | $230,540 |
| 2018 | $2,710 | $294,710 | $85,000 | $209,710 |
| 2017 | $2,504 | $264,460 | $60,000 | $204,460 |
| 2016 | $2,357 | $241,060 | $50,000 | $191,060 |
| 2015 | $2,299 | $229,930 | $45,000 | $184,930 |
| 2013 | $1,056 | $199,960 | $42,000 | $157,960 |
Source: Public Records
Map
Nearby Homes
- 3752 N Shelburne Loop
- 3788 N Shelburne Loop
- 2815 N Slice Dr
- 2770 N Slice
- 880 E Allenby Ct
- 975 E Stoneybrook Loop
- 333 E Penrose Ave
- 908 E Allenby Ct
- 3351 N Blaze Loop
- 3596 Blaze Loop
- 3510 N Blaze Loop
- 3542 N Blaze Loop
- 3556 N Blaze Loop
- 3566 N Blaze Loop
- 984 E Allenby Ave
- 3576 N Blaze Loop
- 3679 N Blaze Loop
- 3636 N Blaze Loop
- 3606 N Blaze Loop
- 3624 N Blaze Loop
- 445 E Titanium Ct
- 425 E Titanium Ct
- 450 E Titanium Ct
- 445 Titatium Ct
- 405 E Titanium Ct
- 3080 N Slice Dr
- 395 E Titanium Ct
- 430 E Titanium Ct
- 3060 N Slice
- 385 E Titanium Ct
- 3030 N Slice Dr
- 3613 N Shelburne Loop
- 3631 N Shelburne Loop
- 3595 N Shelburne Loop
- 3095 N Slice Dr
- 3631 N Shelburne Loop
- 3595 N Shelburne Loop
- 3641 N Shelburne Loop
- 3613 N Shelburne Loop
- 3577 Shelburne Loop
Your Personal Tour Guide
Ask me questions while you tour the home.