435 E Webster St Ferndale, MI 48220
Estimated Value: $182,000 - $212,000
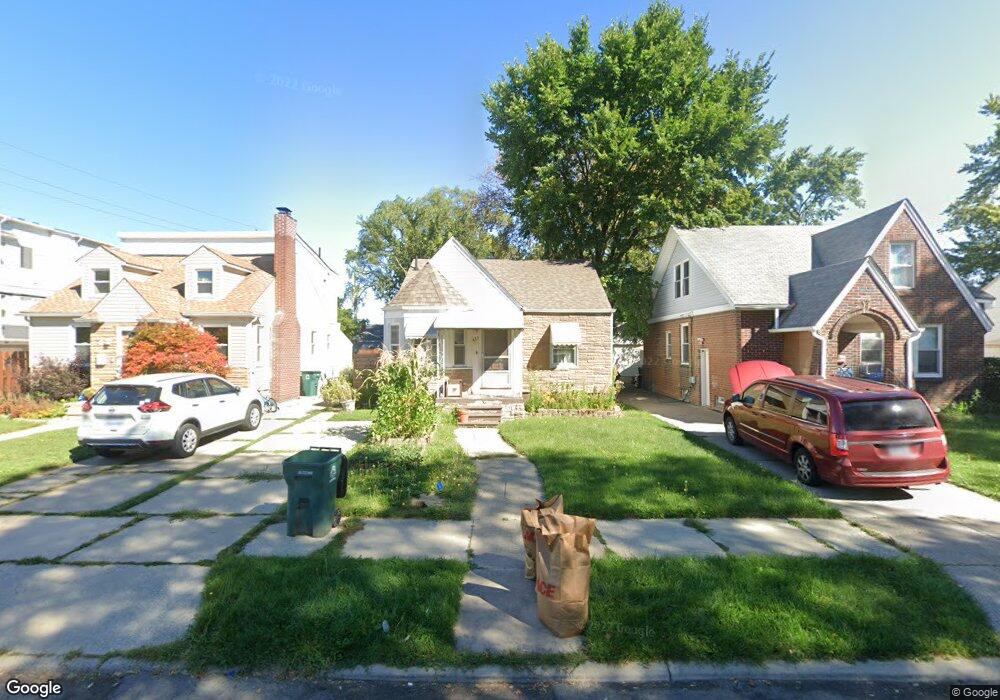
About This Home
This home is located at 435 E Webster St, Ferndale, MI 48220 and is currently estimated at $191,852, approximately $254 per square foot. 435 E Webster St is a home located in Oakland County with nearby schools including Ferndale Lower Elementary Campus, Ferndale Upper Elementary Campus, and Ferndale Middle School.
Ownership History
We collect this data history from publicly available records. To have your information removed, we recommend requesting removal directly through your county’s website.
Purchase Details
Home Financials for this Owner
Home Financials are based on the most recent Mortgage that was taken out on this home.Purchase Details
Purchase Details
Home Values in the Area
Average Home Value in this Area
Purchase History
We collect this data history from publicly available records. To have your information removed, we recommend requesting removal directly through your county’s website.
| Date | Buyer | Sale Price | Title Company |
|---|---|---|---|
| $88,000 | -- | ||
| $55,900 | -- | ||
| $20,500 | -- |
Mortgage History
We collect this data history from publicly available records. To have your information removed, we recommend requesting removal directly through your county’s website.
| Date | Status | Borrower | Loan Amount |
|---|---|---|---|
| Previous Owner | $87,310 | ||
| Closed | $0 |
Tax History
We collect this data history from publicly available records. To have your information removed, we recommend requesting removal directly through your county’s website.
| Year | Tax Paid | Tax Assessment Tax Assessment Total Assessment is a certain percentage of the fair market value that is determined by local assessors to be the total taxable value of land and additions on the property. | Land | Improvement |
|---|---|---|---|---|
| 2025 | $2,649 | $81,370 | $0 | $0 |
| 2024 | $2,548 | $76,800 | $0 | $0 |
| 2023 | $2,539 | $75,320 | $0 | $0 |
| 2022 | $2,143 | $65,760 | $0 | $0 |
| 2021 | $1,871 | $60,880 | $0 | $0 |
| 2020 | $2,004 | $55,700 | $0 | $0 |
| 2019 | $1,771 | $46,590 | $0 | $0 |
| 2018 | $2,315 | $39,350 | $0 | $0 |
| 2017 | $2,414 | $37,090 | $0 | $0 |
| 2016 | $2,056 | $31,510 | $0 | $0 |
| 2015 | -- | $28,600 | $0 | $0 |
| 2014 | -- | $24,880 | $0 | $0 |
| 2011 | -- | $32,360 | $0 | $0 |
Map
- 426 E Webster St
- 342 Spencer St
- 674 E Webster St
- 521 E Chesterfield St
- 420 Silman St
- 733 Camden St
- 441 Silman St
- 634 Channing St
- 708 Channing St
- 561 E Bennett Ave
- 388 Channing St
- 306 Silman St
- 872 Channing St
- 691 E Bennett Ave
- 640 Wordsworth St
- 690 E Marshall St
- 839 E Bennett Ave
- 231 W Bennett Ave
- 266 W Bennett Ave
- 243 W Webster St
- 450 Hilton Rd Unit 2
- 454 Hilton Rd
- 394 Hilton Rd Unit 2
- 394 Hilton Rd Unit 101
- 394 Hilton Rd Unit 101
- 450 Hilton Rd Unit 14
- 444 Hilton Rd
- 424 Hilton Rd
- 410 Hilton Rd
- 444 Hilton Rd Unit 12
- 444 Hilton Rd Unit 112
- 444 Hilton Rd Unit 444
- 390 Hilton Rd Unit 2
- 420 Hilton Rd
- 414 Hilton Rd
- 414 Hilton Rd Unit 105
- 414 Hilton Rd Unit 5
- 430 Hilton Rd
- 404 Hilton Rd
- 434 Hilton Rd
Ask me questions while you tour the home.